Why Today’s Housing Market Is Not About To Crash

There’s been some concern lately that the housing market is headed for a crash. And given some of the affordability challenges in the housing market, along with a lot of recession talk in the media, it’s easy enough to understand why that worry has come up.
But the data clearly shows today’s market is very different than it was before the housing crash in 2008. Rest assured, this isn’t a repeat of what happened back then. Here’s why.
It’s Harder To Get a Loan Now
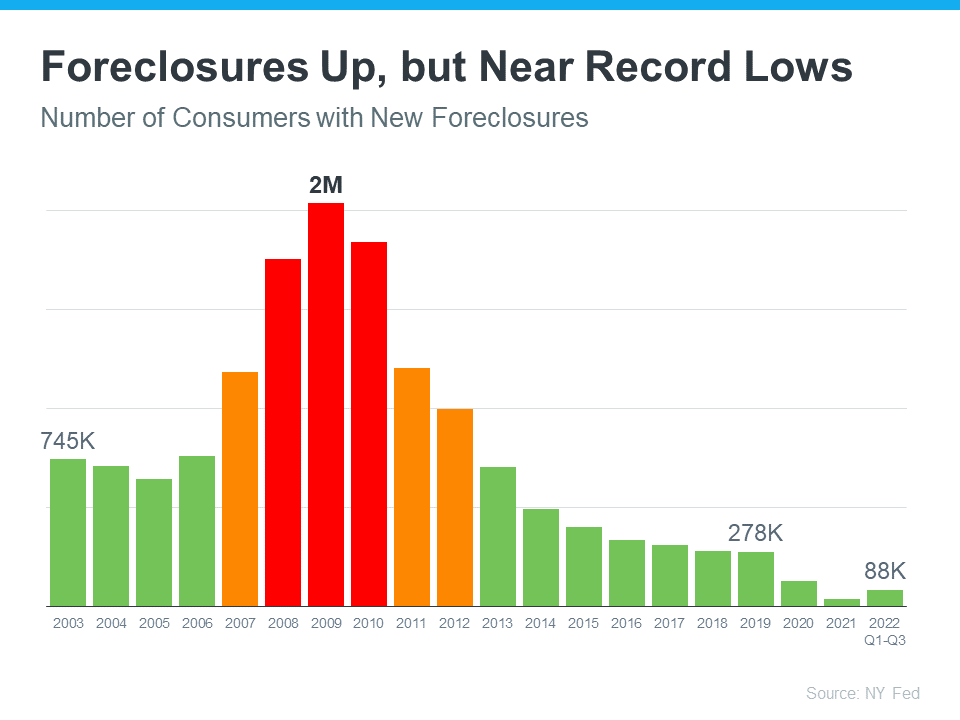
It was much easier to get a home loan during the lead-up to the 2008 housing crisis than it is today. Back then, banks had different lending standards, making it easy for just about anyone to qualify for a home loan or refinance an existing one. As a result, lending institutions took on much greater risk in both the person and the mortgage products offered. That led to mass defaults, foreclosures, and falling prices.
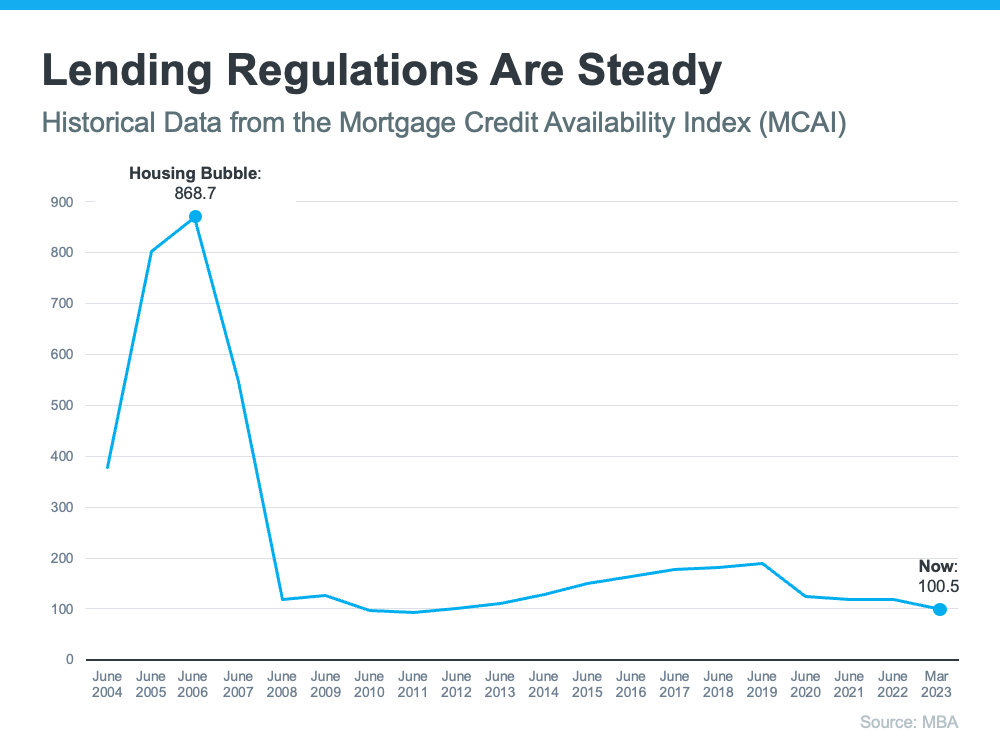
Things are different today as purchasers face increasingly higher standards from mortgage companies. The graph below uses data from the Mortgage Bankers Association (MBA) to show this difference. The lower the number, the harder it is to get a mortgage. The higher the number, the easier it is.
 Unemployment Recovered Faster This Time
While the pandemic caused unemployment to spike over the last couple of years, the jobless rate has already recovered back to pre-pandemic levels (see the blue line in the graph below). Things were different during the Great Recession as a large number of people stayed unemployed for a much longer period of time (see the red in the graph below):
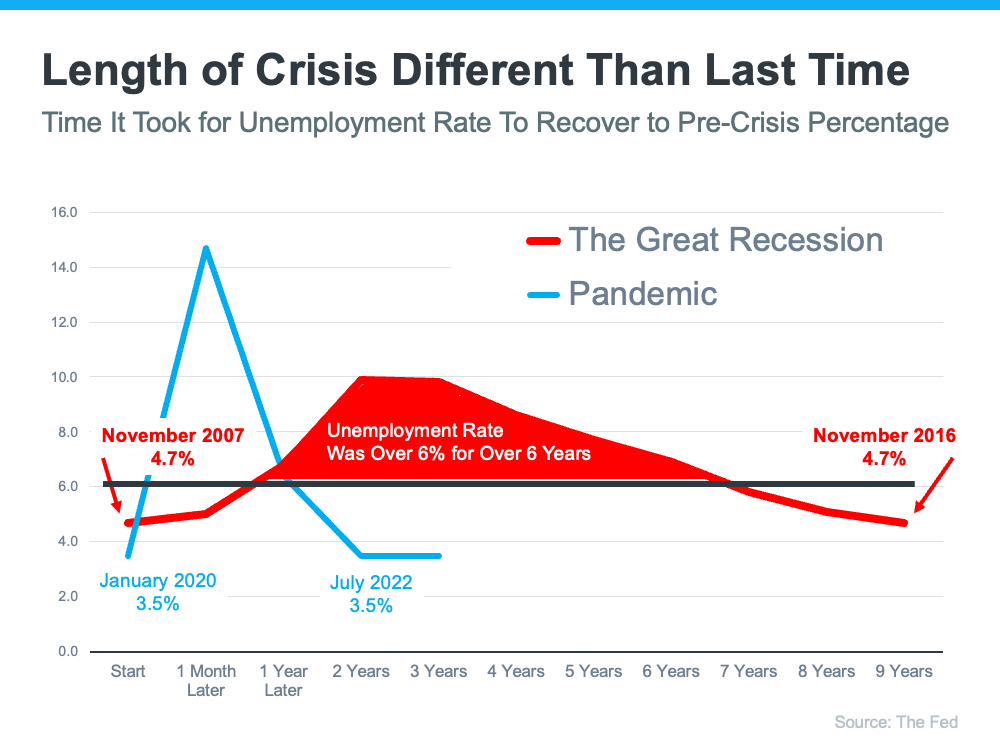
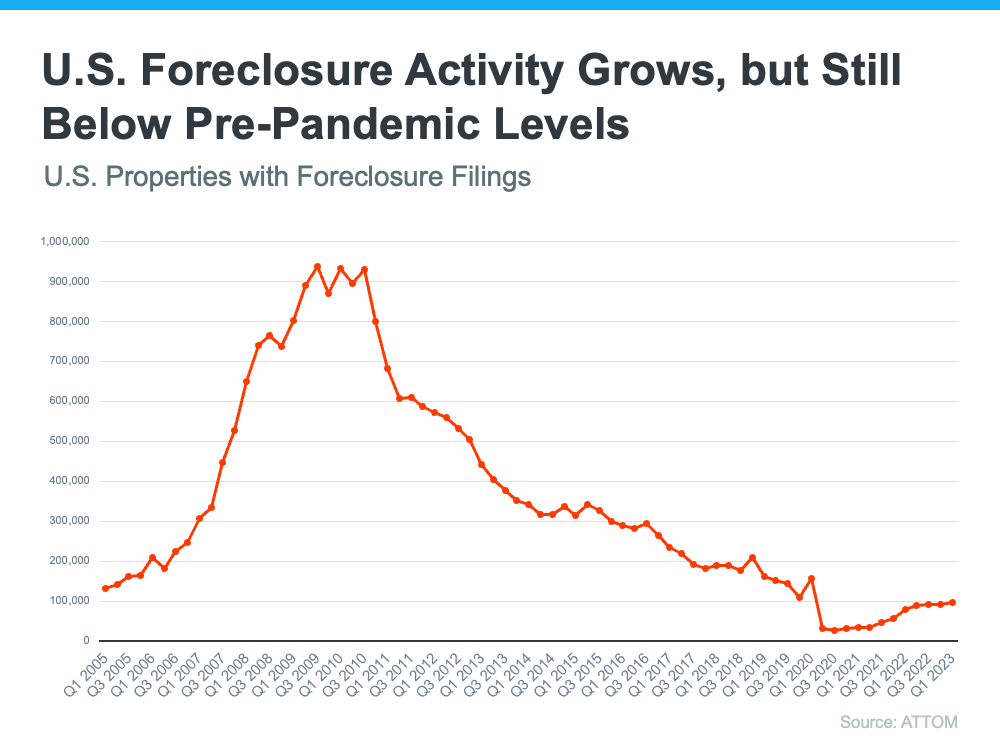
Here’s how the quick job recovery this time helps the housing market. Because so many people are employed today, there’s less risk of homeowners facing hardship and defaulting on their loans. This helps put today’s housing market on stronger footing and reduces the risk of more foreclosures coming onto the market.
There Are Far Fewer Homes for Sale Today
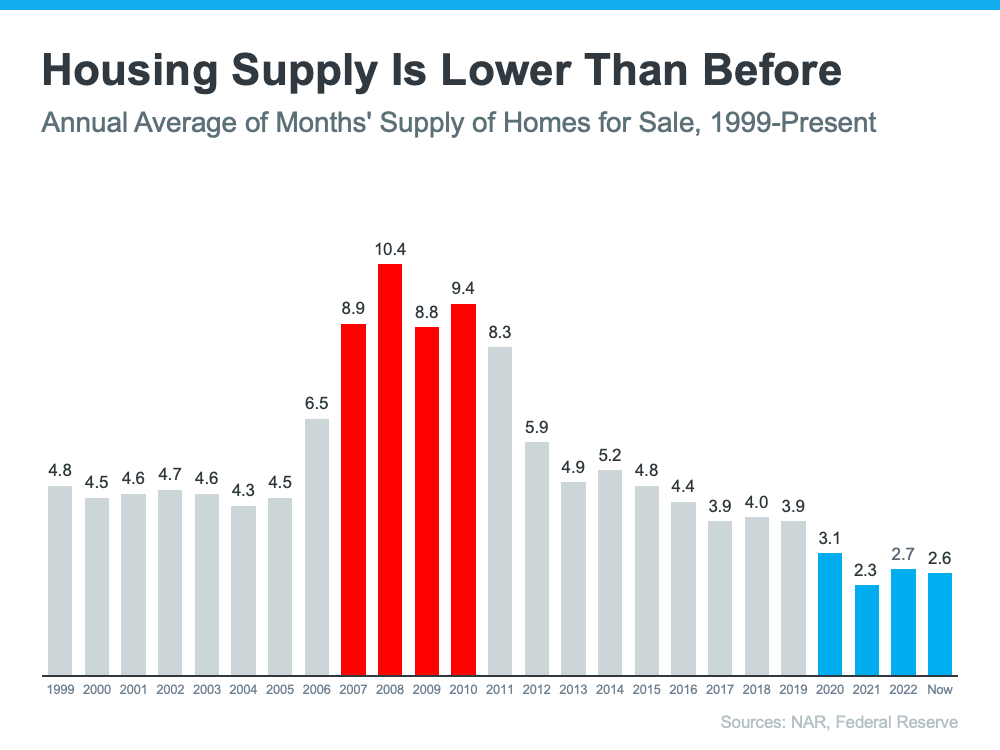
There were also too many homes for sale during the housing crisis (many of which were short sales and foreclosures), and that caused prices to fall dramatically. Today, there’s a shortage of inventory available overall, primarily due to years of underbuilding homes.
The graph below uses data from the National Association of Realtors (NAR) and the Federal Reserve to show how the months’ supply of homes available now compares to the crash. Today, unsold inventory sits at just a 2.6-months’ supply. There just isn’t enough inventory on the market for home prices to come crashing down like they did in 2008.
Equity Levels Are Near Record Highs
That low inventory of homes for sale helped keep upward pressure on home prices over the course of the pandemic. As a result, homeowners today have near-record amounts of equity (see graph below):
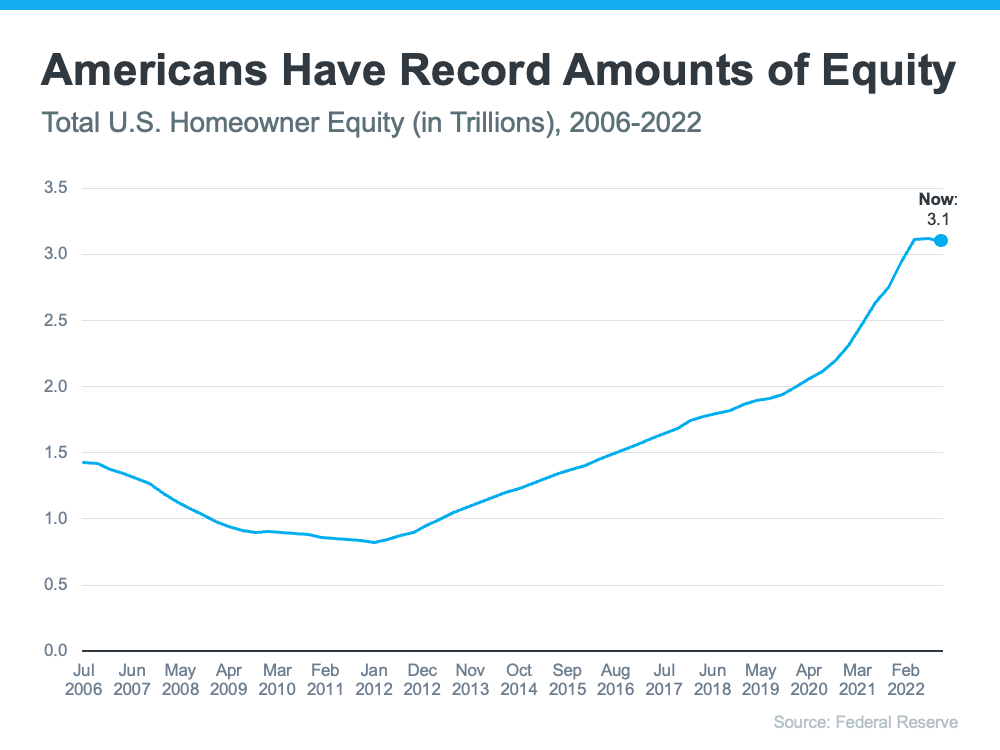
And, that equity puts them in a much stronger position compared to the Great Recession. Molly Boesel, Principal Economist at CoreLogic, explains:
“Most homeowners are well positioned to weather a shallow recession. More than a decade of home price increases has given homeowners record amounts of equity, which protects them from foreclosure should they fall behind on their mortgage payments.”
SBottom Line
The graphs above should ease any fears you may have that today’s housing market is headed for a crash. The most current data clearly shows that today’s market is nothing like it was last time.


![Here’s Why the Housing Market Isn’t Going To Crash [INFOGRAPHIC]](https://housingcoach.com/wp-content/uploads/2023/03/20230317_Heres-Why-The-Housing-Market-Isnt-Going-To-Crash-KCM-Share.png)
![Here’s Why the Housing Market Isn’t Going To Crash [INFOGRAPHIC] Simplifying The Market](https://files.keepingcurrentmatters.com/content/images/20230316/20230317_Heres-Why-The-Housing-Market-Isnt-Going-To-Crash-KCM-Share.png)