Some Experts Say Mortgage Rates May Fall Below 6% Later This Year

Some Experts Say Mortgage Rates May Fall Below 6% Later This Year

Some Experts Say Mortgage Rates May Fall Below 6% Later This Year Simplifying The Market

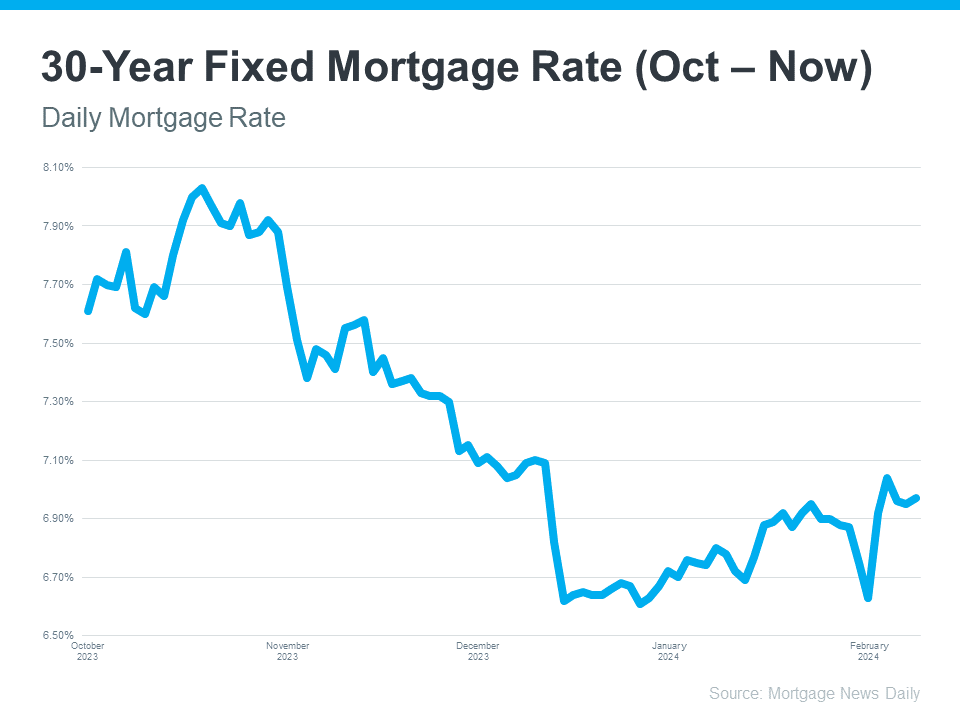
There’s a lot of confusion in the market about what’s happening with day-to-day movement in mortgage rates right now, but here’s what you really need to know: compared to the near 8% peak last fall, mortgage rates have trended down overall.

And if you’re looking to buy or sell a home, this is a big deal. While they’re going to continue to bounce around a bit based on various economic drivers (like inflation and reactions to the consumer price index, or CPI), don’t let the short-term volatility distract you. The experts agree the overarching downward trend should continue this year.

While we won’t see the record-low rates homebuyers got during the pandemic, some experts think we should see rates dip below 6% later this year. As Dean Baker, Senior Economist, Center for Economic Research, says:

“They will almost certainly not fall to pandemic lows, although we may soon see rates under 6.0 percent, which would be low by pre-Great Recession standards.

And Baker isn’t the only one saying this is a possibility. The latest Fannie Mae projections also indicate we may see a rate below 6% by the end of this year (see the green box in the chart below):

 a blue and white graph with text

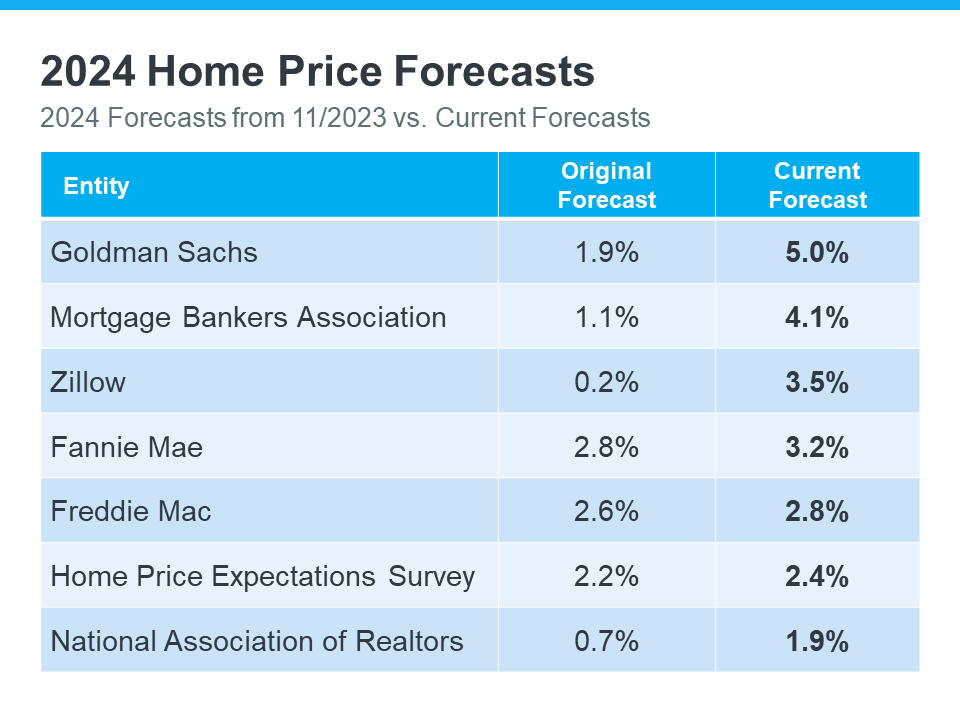
The chart shows mortgage rate projections for 2024 from Fannie Mae. It includes the one that came out in December, and compares it to the updated 2024 forecast they released just one month later. And if you look closely, you’ll notice the projections are on the way down.

It’s normal for experts to re-forecast as they watch current market trends and the broader economy, but what this shows is experts are feeling confident rates should continue to decline, if inflation cools.

What This Means for You

But remember, no one can say for sure what will happen (and by when) – and short-term volatility is to be expected. So, don’t let small fluctuations scare you. Focus on the bigger picture.

If you’ve found a home you love in today’s market – especially where finding a home that meets your budget and your needs can be a challenge – it’s probably not a good idea to try to time the market and wait until rates drop below 6%.

With rates already lower than they were last fall, you have an opportunity in front of you right now. That’s because even a small quarter point dip in rates gives your purchasing power a boost.

Bottom Line

If you wanted to move last year but were holding off hoping rates would fall, now may be the time to act. Connect with a real estate agent to get the ball rolling. 

Don’t Let the Latest Home Price Headlines Confuse You

Don’t Let the Latest Home Price Headlines Confuse You

Don’t Let the Latest Home Price Headlines Confuse You Simplifying The Market

Based on what you’re hearing in the news about home prices, you may be worried they’re falling. But here’s the thing. The headlines aren’t giving you the full picture.

If you look at the national data for 2023, home prices actually showed positive growth for the year. While this varies by market, and while there were some months with slight declines nationally, those were the exception, not the rule.

The overarching story is that prices went up last year, not down. Let’s dive into the data to set the record straight. 

2023 Was the Return to More Normal Home Price Growth

If anything, last year marked a return to more normal home price appreciation. To prove it, here’s what usually happens in residential real estate.

In the housing market, there are predictable ebbs and flows that take place each year. It’s called seasonality. It goes like this. Spring is the peak homebuying season when the market is most active. That activity is usually still strong in the summer, but begins to wane toward the end of the year. Home prices follow along with this seasonality because prices grow the most when there’s high demand.

The graph below uses data from Case-Shiller to show how this pattern played out in home prices from 1973 through 2022 (not adjusted, so you can see the seasonality):


As the data shows, for nearly 50 years, home prices match typical market seasonality. At the beginning of the year, home prices grow more moderately. That’s because the market is less active as fewer people move in January and February. Then, as the market transitions into the peak homebuying season in the spring, activity ramps up. That means home prices do too. Then, as fall and winter approach, activity eases again and prices grow, just at a slower rate.

Now, let’s layer the data that’s come out for 2023 so far (shown in green) on top of that long-term trend (still shown in blue). That way, it’s easy to see how 2023 compares.

As the graph shows, moving through the year in 2023, the level of appreciation fell more in line with the long-term trend for what usually happens in the housing market. You can see that in how close the green bars come to matching the blue bars in the later part of the year.

But the headlines only really focused on the two bars outlined in red. Here’s the context you may not have gotten that can really put those two bars into perspective. The long-term trend shows it’s normal for home prices to moderate in the fall and winter. That’s typical seasonality.

And since the 49-year average is so close to zero during those months (0.10%), that also means it’s not unusual for home prices to drop ever so slightly during those times. But those are just blips on the radar. If you look at the year as a whole, home prices still rose overall.

What You Really Need To Know

Headlines are going to call attention to the small month-to-month dips instead of the bigger year-long picture. And that can be a bit misleading because it’s only focused on one part of the whole story.

Instead, remember last year we saw the return of seasonality in the housing market – and that’s a good thing after home prices skyrocketed unsustainably during the ‘unicorn’ years of the pandemic.

And just in case you’re still worried home prices will fall, don’t be. The expectation for this year is that prices will continue to appreciate as buyers re-enter the market due to mortgage rates trending down compared to last year. As buyer demand goes up and more people move at the same time the supply of homes for sale is still low, the upward pressure on prices will continue.

Bottom Line

Don’t let home price headlines confuse you. The data shows that, as a whole, home prices rose in 2023. If you have questions about what you’re hearing in the news or about what’s happening with home prices in your local area, connect with a trusted real estate professional.

What’s Really Happening with Mortgage Rates?

What’s Really Happening with Mortgage Rates?

What’s Really Happening with Mortgage Rates? Simplifying The Market

Are you feeling a bit unsure about what’s really happening with mortgage rates? That might be because you’ve heard someone say they’re coming down. But then you read somewhere else that they’re up again. And that may leave you scratching your head and wondering what’s true.

The simplest answer is: that what you read or hear will vary based on the time frame they’re looking at. Here’s some information that can help clear up the confusion.

Mortgage Rates Are Volatile by Nature

Mortgage rates don’t move in a straight line. There are too many factors at play for that to happen. Instead, rates bounce around because they’re impacted by things like economic conditions, decisions from the Federal Reserve, and so much more. That means they might be up one day and down the next depending on what’s going on in the economy and the world as a whole.

Take a look at the graph below. It uses data from Mortgage News Daily to show the ebbs and flows in the 30-year fixed mortgage rate since last October:


If you look at the graph, you’ll see a lot of peaks and valleys – some bigger than others. And when you use data like this to explain what’s happening, the story can be different based on which two points in the graph you’re comparing.

For example, if you’re only looking at the beginning of this month through now, you may think mortgage rates are on the way back up. But, if you look at the latest data point and compare it to the peak in October, rates have trended down. So, what’s the right way to look at it?

The Big Picture

Mortgage rates are always going to bounce around. It’s just how they work. So, you shouldn’t focus too much on the small, daily changes. Instead, to really understand the overall trend, zoom out and look at the big picture.

When you look at the highest point (October) compared to where rates are now, you can see they’ve come down compared to last year. And if you’re looking to buy a home, this is big news. Don’t let the little blips distract you. The experts agree, overall, that the larger downward trend could continue this year

Bottom Line

Connect with a professional if you have any questions about what you’re reading or hearing about the housing market.

Houses Are Still Selling Fast

Houses Are Still Selling Fast

Houses Are Still Selling Fast Simplifying The Market

Have you been thinking about selling your house? If so, here’s some good news. While the housing market isn’t as frenzied as it was during the ‘unicorn’ years when houses were selling quicker than ever, they’re still selling faster than normal.

The graph below uses data from Realtor.com to tell the story of median days on the market for every January from 2017 all the way through the latest numbers available. For Realtor.com, days on the market means from the time a house is listed for sale until its closing date or the date it’s taken off the market. This metric can help give you an idea of just how quickly homes are selling compared to more normal years:


When you look at the most recent data (shown in green), it’s clear homes are selling faster than they usually would (shown in blue). In fact, the only years when houses sold even faster than they are right now were the abnormal ‘unicorn’ years (shown in pink). According to Realtor.com:

“Homes spent 69 days on the market, which is three days shorter than last year and more than two weeks shorter than before the COVID-19 pandemic.”

What Does This Mean for You?

Homes are selling faster than the norm for this time of year – and your house may sell quickly too. That’s because more people are looking to buy now that mortgage rates have come down, but there still aren’t enough homes to go around. Mike Simonsen, Founder of Altos Research, says:

“. . . 2024 is starting stronger than last year. And demand is increasing each week.”

Bottom Line

If you’re wondering if it’s a good time to sell your home, the most recent data suggests it is. The housing market appears to be stronger than it usually is at this time of year. To get the latest updates on what’s happening in your local market, connect with a real estate agent.

Foreclosure Activity Is Still Lower than the Norm

Foreclosure Activity Is Still Lower than the Norm

Foreclosure Activity Is Still Lower than the Norm Simplifying The Market

Have you seen headlines talking about the increase in foreclosures in today’s housing market? If so, they may leave you feeling a bit uneasy about what’s ahead. But remember, these clickbait titles don’t always give you the full story.

The truth is, if you compare the current numbers with what usually happens in the market, you’ll see there’s no need to worry.

Putting the Headlines into Perspective

The increase the media is calling attention to is misleading. That’s because they’re only comparing the most recent numbers to a time where foreclosures were at historic lows. And that’s making it sound like a bigger deal than it is.

In 2020 and 2021, the moratorium and forbearance program helped millions of homeowners stay in their homes, allowing them to get back on their feet during a very challenging period.

When the moratorium came to an end, there was an expected rise in foreclosures. But just because foreclosures are up doesn’t mean the housing market is in trouble.

Historical Data Shows There Isn’t a Wave of Foreclosures

Instead of comparing today’s numbers with the last few abnormal years, it’s better to compare to long-term trends – specifically to the housing crash – since that’s what people worry may happen again.

Take a look at the graph below. It uses foreclosure data from ATTOM, a property data provider, to show foreclosure activity has been consistently lower (shown in orange) since the crash in 2008 (shown in red):

So, while foreclosure filings are up in the latest report, it’s clear this is nothing like it was back then.

In fact, we’re not even back at the levels we’d see in more normal years, like 2019. As Rick Sharga, Founder and CEO of the CJ Patrick Company, explains:

Foreclosure activity is still only at about 60% of pre-pandemic levels. . .”

That’s largely because buyers today are more qualified and less likely to default on their loans. Delinquency rates are still low and most homeowners have enough equity to keep them from going into foreclosure. As Molly Boesel, Principal Economist at CoreLogic, says:

“U.S. mortgage delinquency rates remained healthy in October, with the overall delinquency rate unchanged from a year earlier and the serious delinquency rate remaining at a historic low… borrowers in later stages of delinquencies are finding alternatives to defaulting on their home loans.”

The reality is, while increasing, the data shows a foreclosure crisis is not where the market is today, or where it’s headed.

Bottom Line

Even though the housing market is experiencing an expected rise in foreclosures, it’s nowhere near the crisis levels seen when the housing bubble burst. If you have questions about what you’re hearing or reading about the housing market, connect with a real estate agent.

Pin It on Pinterest