The Housing Market Is on Solid Ground, Even with More Foreclosures

The Housing Market Is on Solid Ground, Even with More Foreclosures

The Housing Market Is on Solid Ground, Even with More Foreclosures Simplifying The Market

It’s been nearly two decades since the 2008 housing crash, but the word “foreclosure” can still make people uneasy. And if you’re planning a move, you may be wondering if more foreclosures will flood the market with homes for sale – especially if you’ve seen the headlines lately.

Buyers may be hoping for a rush of bargains. Sellers may be bracing for more competition. The latest data points to neither, and knowing why can help you plan your next move with confidence.

A Modest Rise from a Low Starting Point

Completed foreclosures are up 33% from last year, according to ATTOM. That sounds like a big leap, but context helps.

Even with that increase, foreclosures are still about 26% below where they were in the first half of 2020.

Zoom out further, and today’s activity is a small fraction of what the market saw during the 2008 crash. Lenders completed about 28,000 foreclosures in the first half of 2026, according to ATTOM. Compare that to the crash years in red, when lenders often completed more than 200,000 in the span of a few months (see graph below):
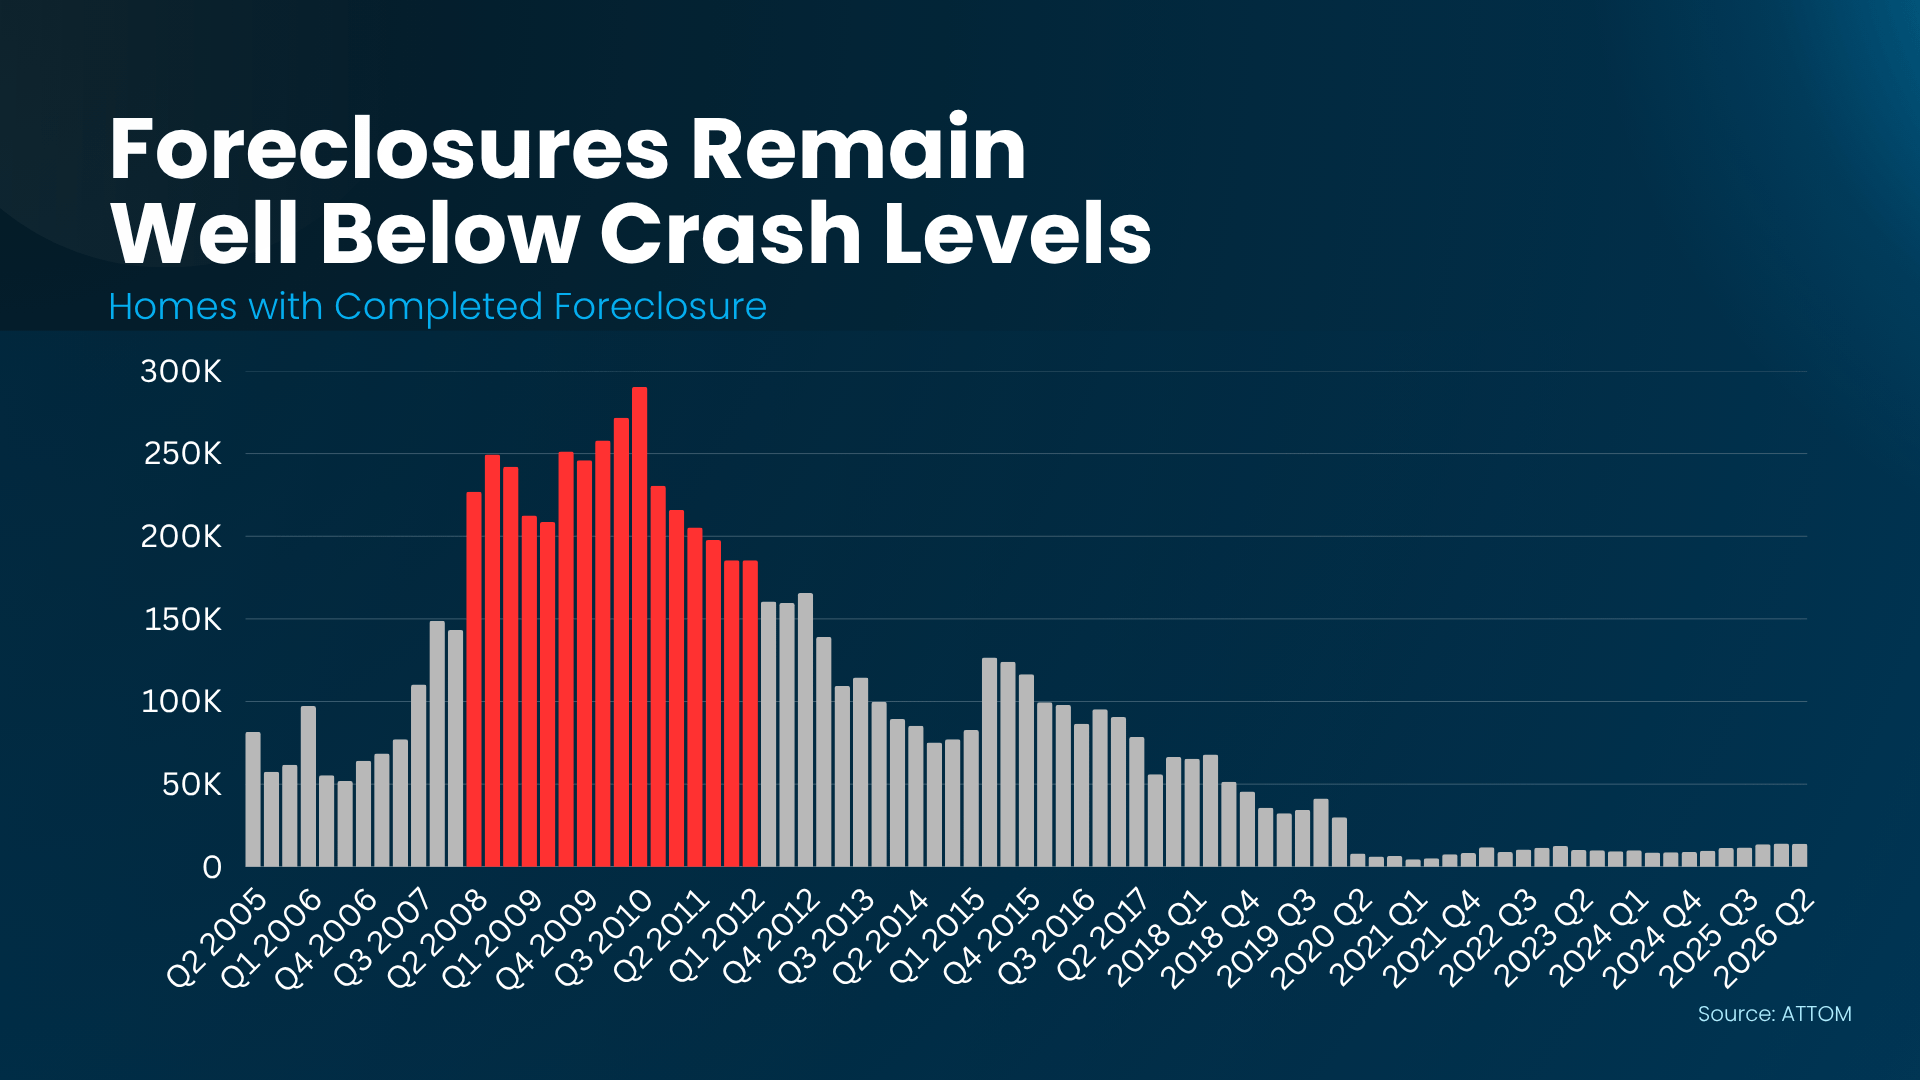
a graph of a crash

Experts say today’s numbers reflect a housing market that’s still in good shape. As Rob Barber, CEO at ATTOM, explains:

“While some homeowners are still facing financial challenges, overall foreclosure volumes remain well below historical norms and the broader housing market continues to demonstrate resilience.”

And here’s why we can absorb the slight uptick in foreclosures we are seeing. 

Homes for Sale Are Back in a Balanced Range

During the crash, a lot of homeowners either lost their homes to foreclosure or were forced to sell, which left the market overwhelmed with houses for sale. That isn’t happening now.

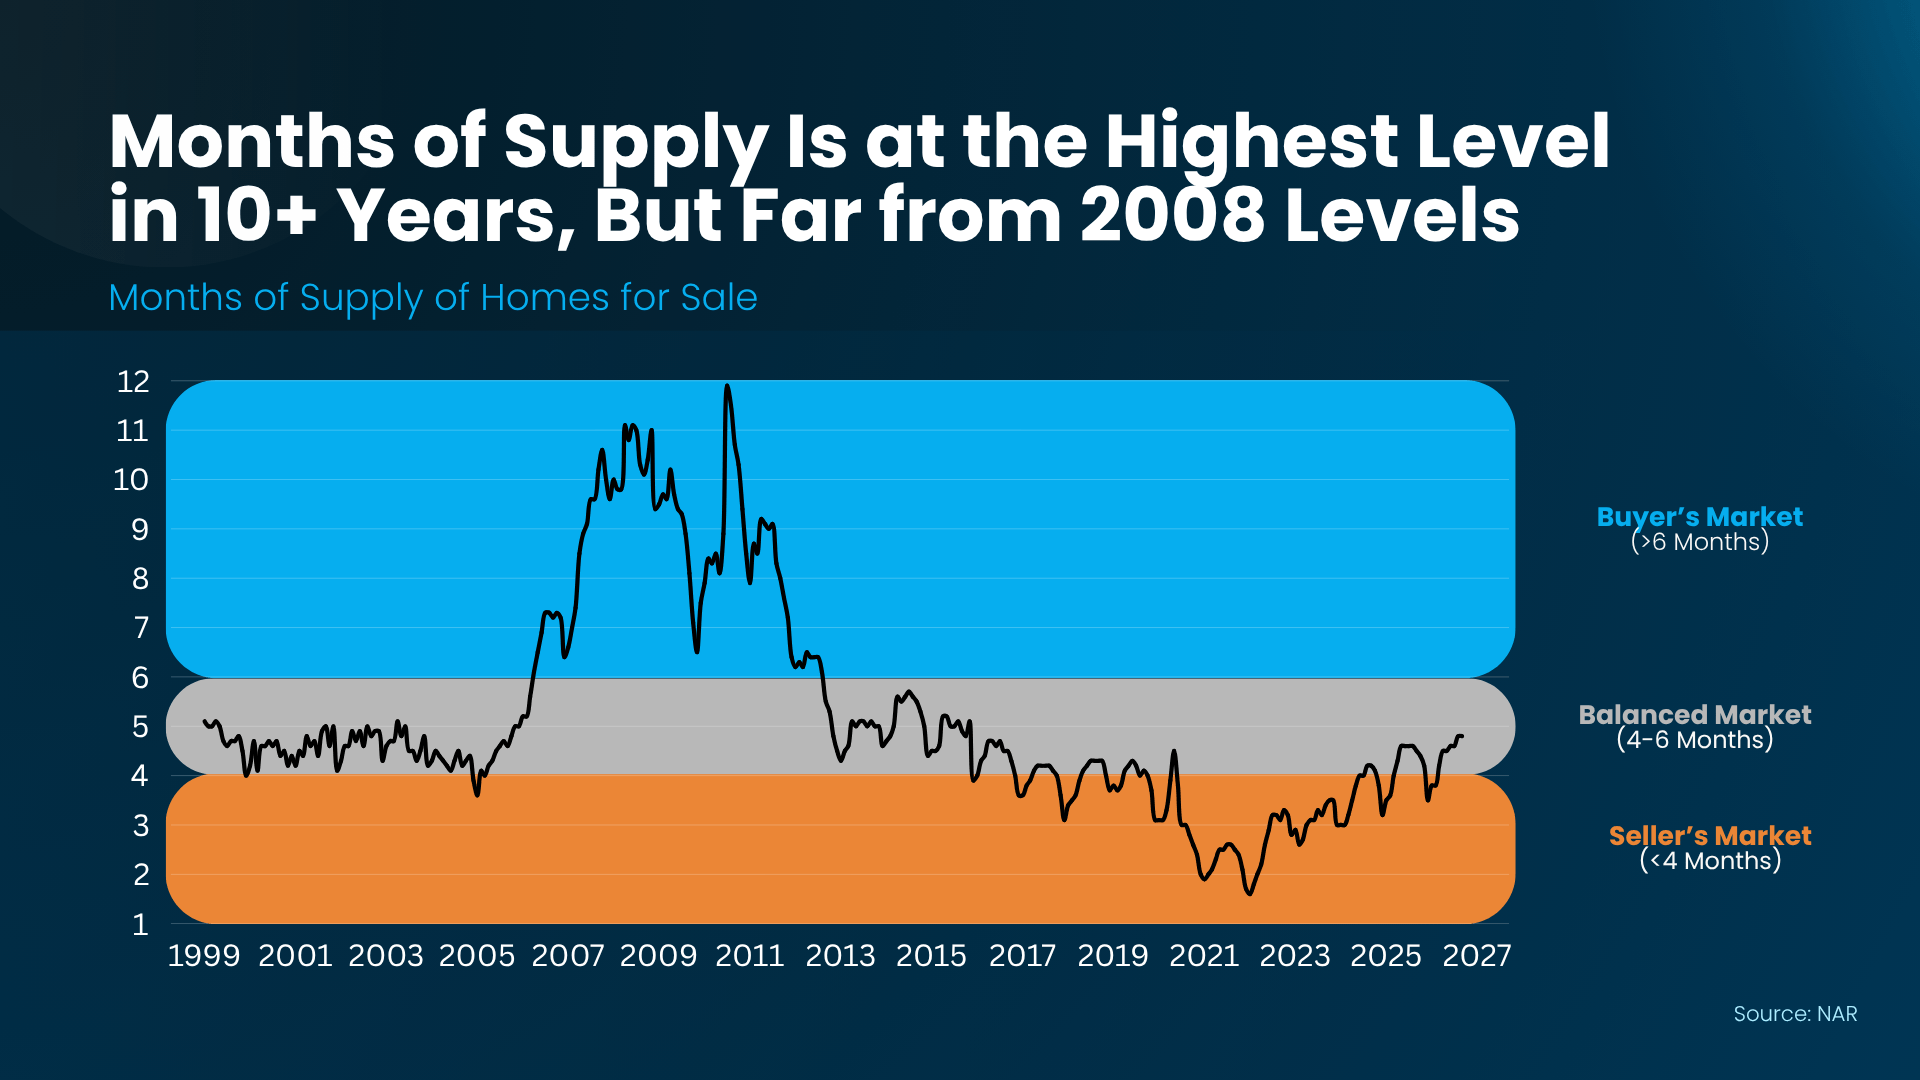
One way to see this is through months’ supply, which measures how long it would take to sell every home on the market at the current pace. Four to six months is considered balanced.

Right now, it’s about 4.8 months, according to the National Association of Realtors (NAR). That’s pretty well-balanced, and less than half of where it peaked around the last crash (see graph below):
a graph of a graph of a graph of a graph of a graph of a graph of a graph of a graph of a graph of a graph of a graph of a graph of a graph of

If foreclosures were really surging, you’d see it in the number of homes for sale. As Logan Mohtashami, Lead Analyst at HousingWire, explains:

“. . . a surge of actual foreclosures in 2026 would have easily put the inventory data much higher in 2026.”

Equity Gives Today’s Homeowners Options

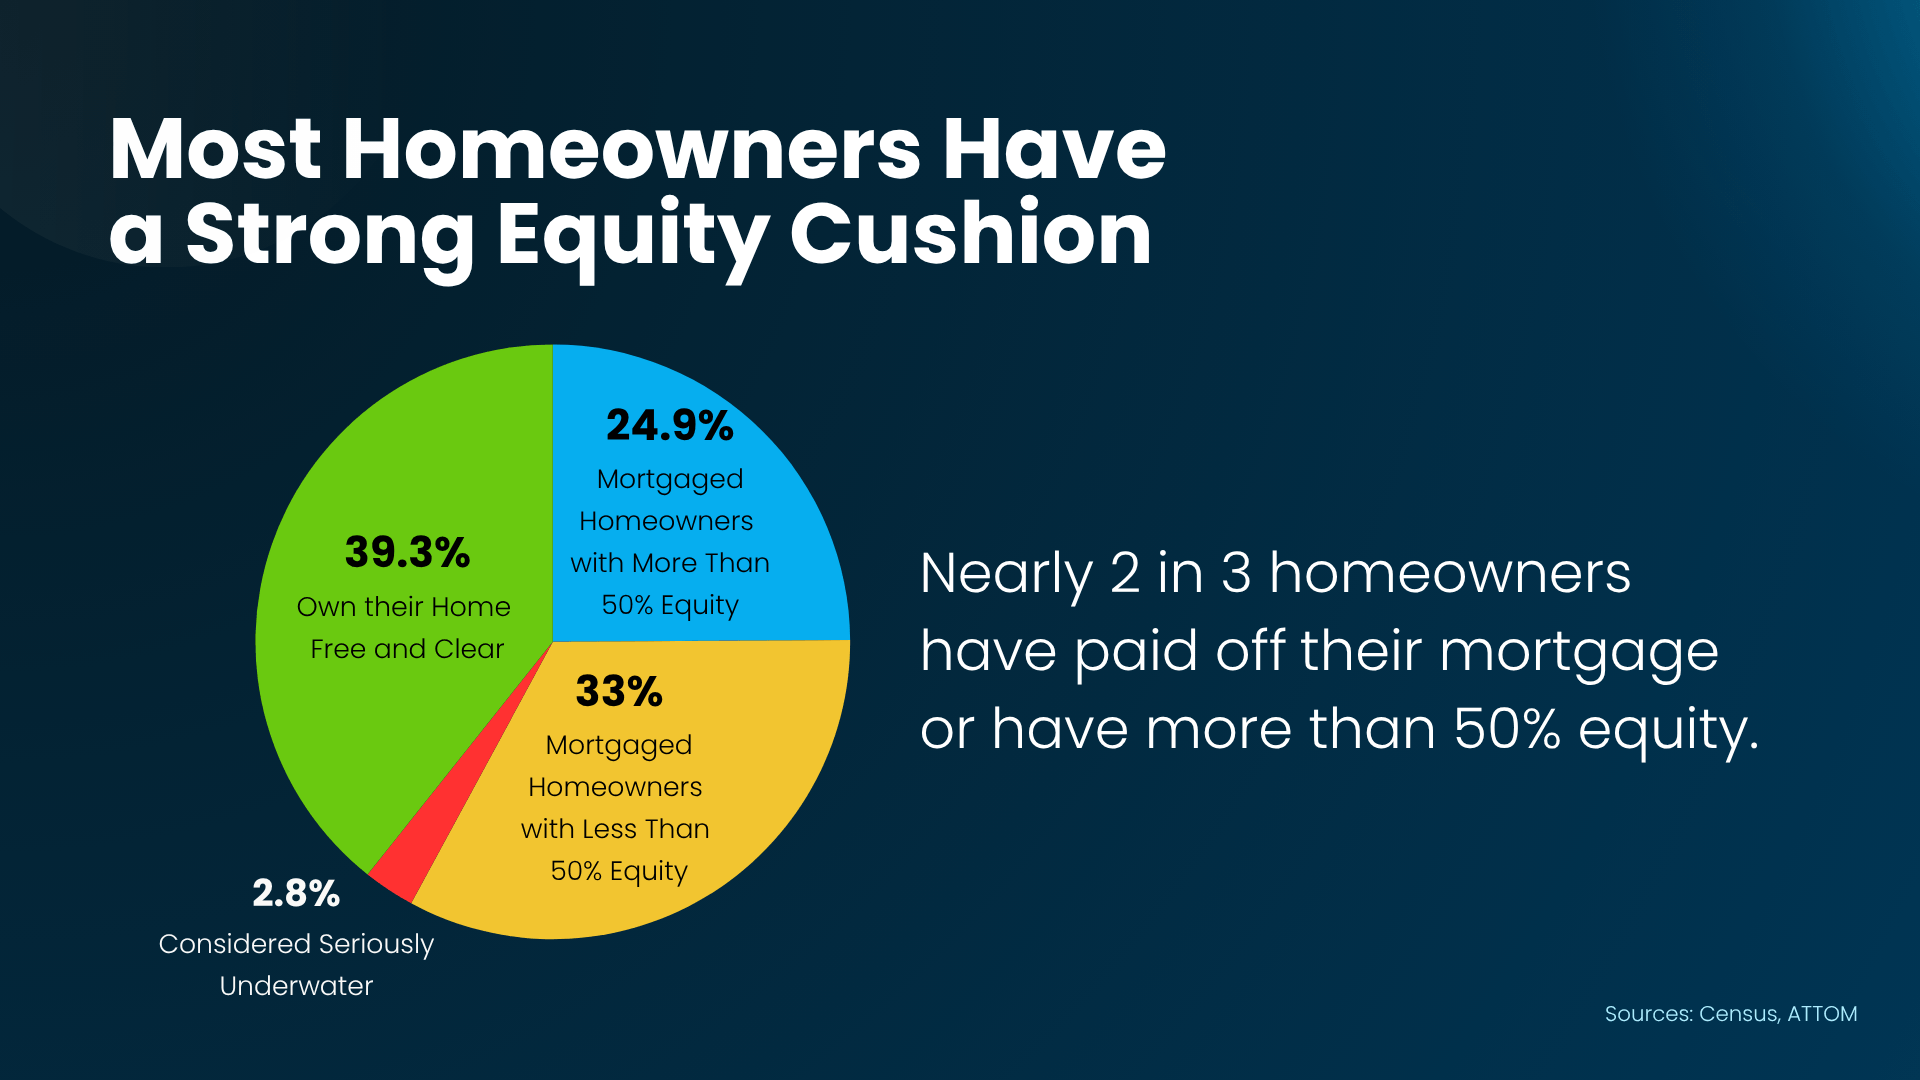
Equity is a big reason there’s no surge of distressed sales. Data from the Census Bureau and ATTOM shows nearly two in three homeowners have paid off their mortgage or have more than 50% equity. And Cotality says the average homeowner has about $310,000 in equity.

If a homeowner with equity hits a rough patch, they can usually sell their house, pay off the loan, and walk away with money in their pocket instead of facing foreclosure. That’s an option many people didn’t have during the crash. According to HousingWire, nearly one in four homes were underwater back in 2010.

Being underwater means owing more on your mortgage than your home is worth, which makes selling a lot harder. Today, just 2% of homeowners are considered seriously underwater (see graph below):
a pie chart with text on it
Not every homeowner has that kind of equity, but most do, and that’s what puts a ceiling on how high foreclosures can go.

Bottom Line

If rising foreclosures have you questioning where the housing market is headed, the data says it’s in good shape. The supply of homes for sale is balanced, and most homeowners have plenty of equity.

Have questions about what you’re seeing online, your local market, or about how much equity you have? Talk to a local real estate agent.


What the Silver Tsunami Means if You’re Planning To Sell

What the Silver Tsunami Means if You’re Planning To Sell

What the Silver Tsunami Means if You’re Planning To Sell Simplifying The Market

If you’re following the housing market, you may have heard the term “silver tsunami” lately. It’s the idea that millions of homes owned by older Americans could come onto the market as more homeowners reach retirement age and make their next move.

And when you hear a phrase like that, it’s easy to picture a flood of houses hitting the market all at once. But that picture doesn’t match the data.

This isn’t expected to happen overnight. 

And if you’re planning to sell, it’s not a reason to put your plans on hold. Let’s look at what the research actually says.

The Silver Tsunami Will Be More of a Gradual Shift

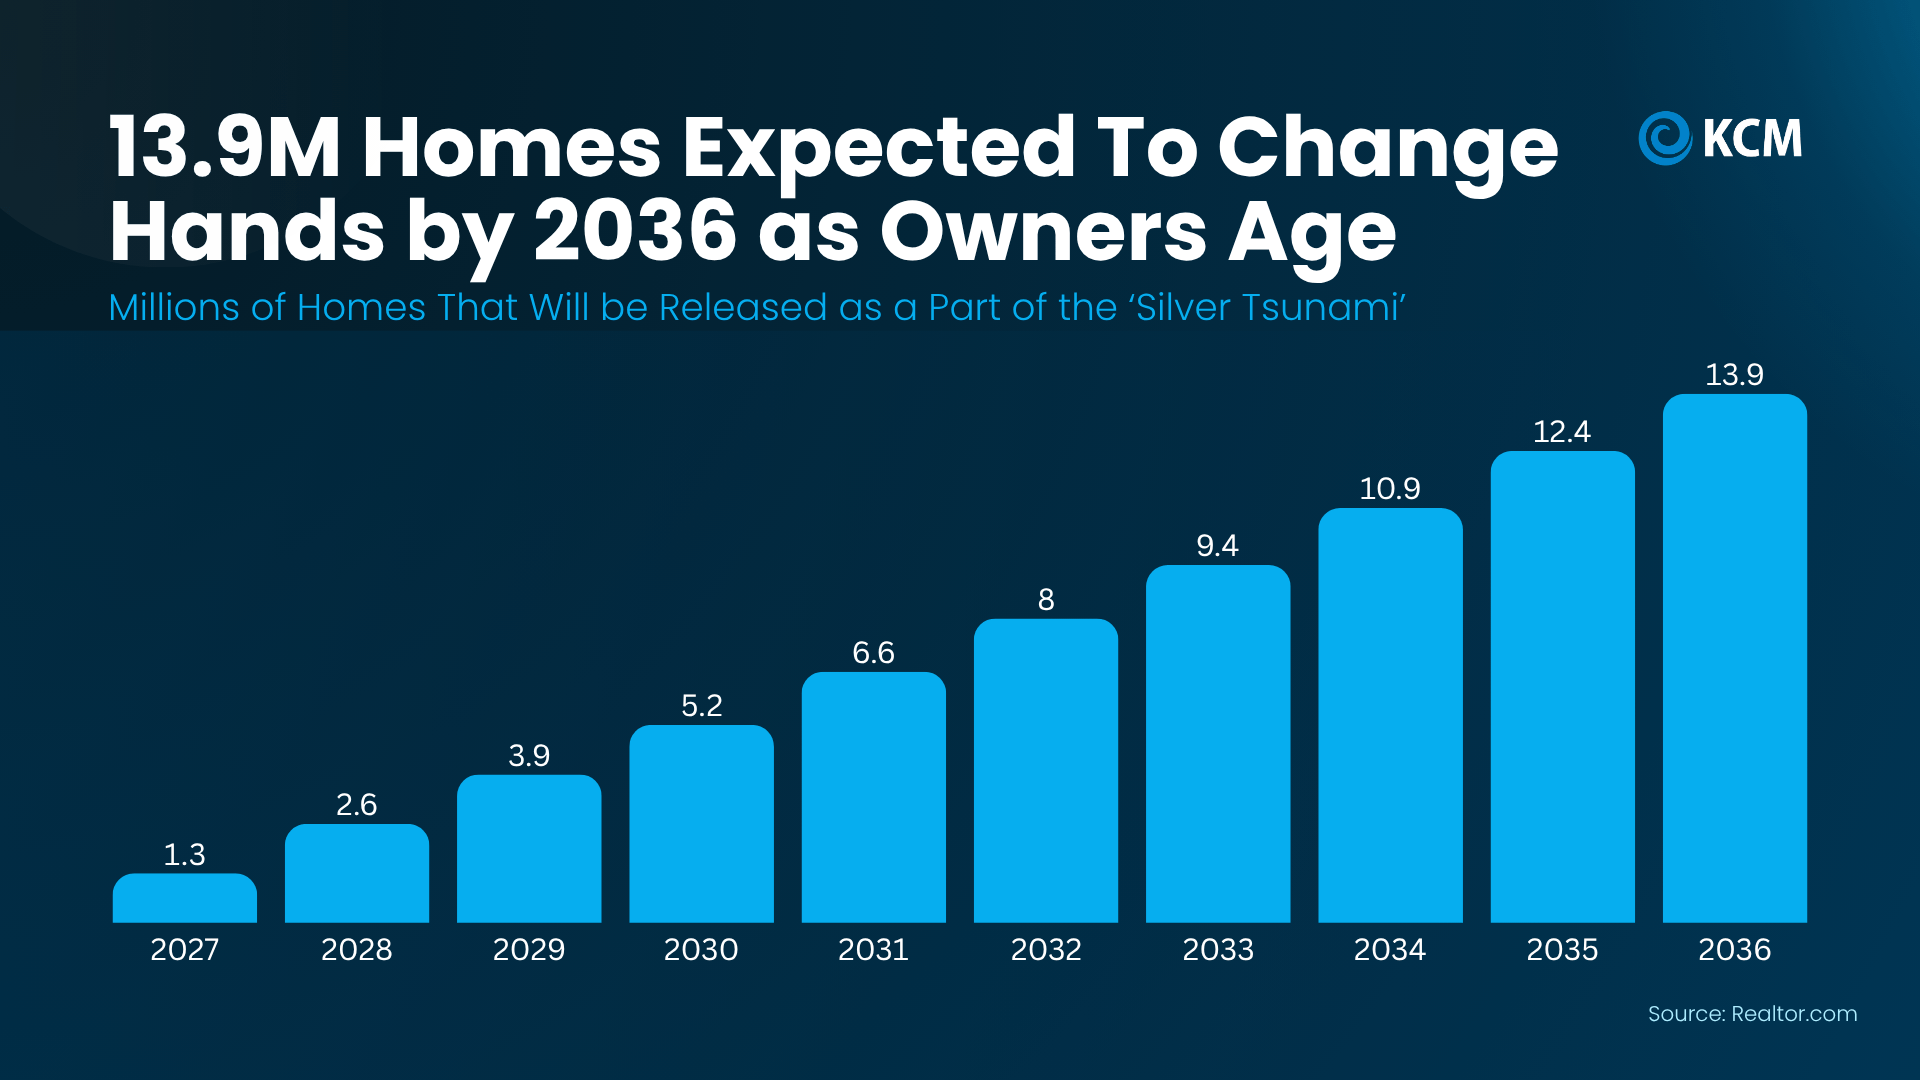
According to Realtor.com, about 13.9 million homes owned by older Americans are expected to change hands by 2036. Sure, that’s a big number. But these homes aren’t all expected to come onto the market at once.

The projections show this happening gradually over the next decade, with roughly 1.3 to 1.5 million homes changing hands each year (see graph below):

a blue graph with white text

Rather than a sudden wave of houses flooding the market, this is a gradual shift as longtime homeowners make decisions about where and how they want to live.

The term silver tsunami makes for a dramatic headline, but the actual data tells a much less dramatic story. And there’s another reason these homes won’t overwhelm the market.

The Market Has Room for More Homes

After the 2008 housing crash, builders significantly slowed construction. And for years afterward, they didn’t build enough homes to keep up with demand. That led to a housing shortage we’re still dealing with today.

And just how big a gap are we talking about? Estimates vary, but many experts say the U.S. is still millions of homes short. For example, a recent report from the White House Council of Economic Advisers explains:

“If homebuilding and the growth of the single-family housing stock had continued at their historical pace instead of falling dramatically after 2008, there would be 10 million or more additional single-family homes today.”

As more longtime homeowners sell, those homes will help a gap that’s already there. But they won’t push us over the edge. That’s because, at the same time, more households are expected to form in the decade ahead, and they’ll need homes, too. 

So, more homes becoming available over time isn’t automatically a bad thing. It can give buyers more options and help create a more balanced housing market moving forward.

What Actually Matters When You Sell

Here’s the takeaway if you’re thinking about selling your house. The silver tsunami isn’t something you need to plan your move around. What’s happening in your local market is far more important than a national projection about the next decade.

That’s because real estate is local. Some markets have more homes for sale than others. Some are seeing houses sell relatively quickly, while others are taking longer.

And those are the conditions that matter when you’re deciding how to price, prepare, and market your house.

For example, an agent who knows your area can help you understand:

  • How many homes are for sale nearby. This tells you how much choice buyers have and how your house will compare.

  • What similar houses are actually selling for. That’s one of the most important factors in setting a competitive asking price.

  • What buyers are looking for right now. Knowing which features and improvements matter most can help your house make a strong first impression.

And that’s something you can act on today, regardless of what happens with the silver tsunami over the next decade.

The right strategy starts with understanding your local market and making decisions based on what’s happening there, not what a dramatic national headline suggests might happen years from now.

Bottom Line

The silver tsunami may sound like a major wave of homes coming onto the market, but the research points to a gradual shift over the next decade, not a sudden flood of listings.

If you’re thinking about selling, don’t let that headline make you second-guess your plans. Talk to an agent about what’s happening in your local market.

Why There are More Homes for Sale Right Now (and What It Means for You)

Why There are More Homes for Sale Right Now (and What It Means for You)

Why There are More Homes for Sale Right Now (and What It Means for You) Simplifying The Market

Mortgage rates being back above 7% isn’t exactly the news most people wanted. But it’s changing the market in ways that matter whether you’re buying or selling.

The number of homes for sale is growing faster than it was this time last year. And interestingly, the main reason isn’t a flood of new listings. It’s because homes aren’t selling as quickly.

Here’s why – and what that means if you’re thinking about buying or selling.

Inventory Growth Is Picking Up Steam

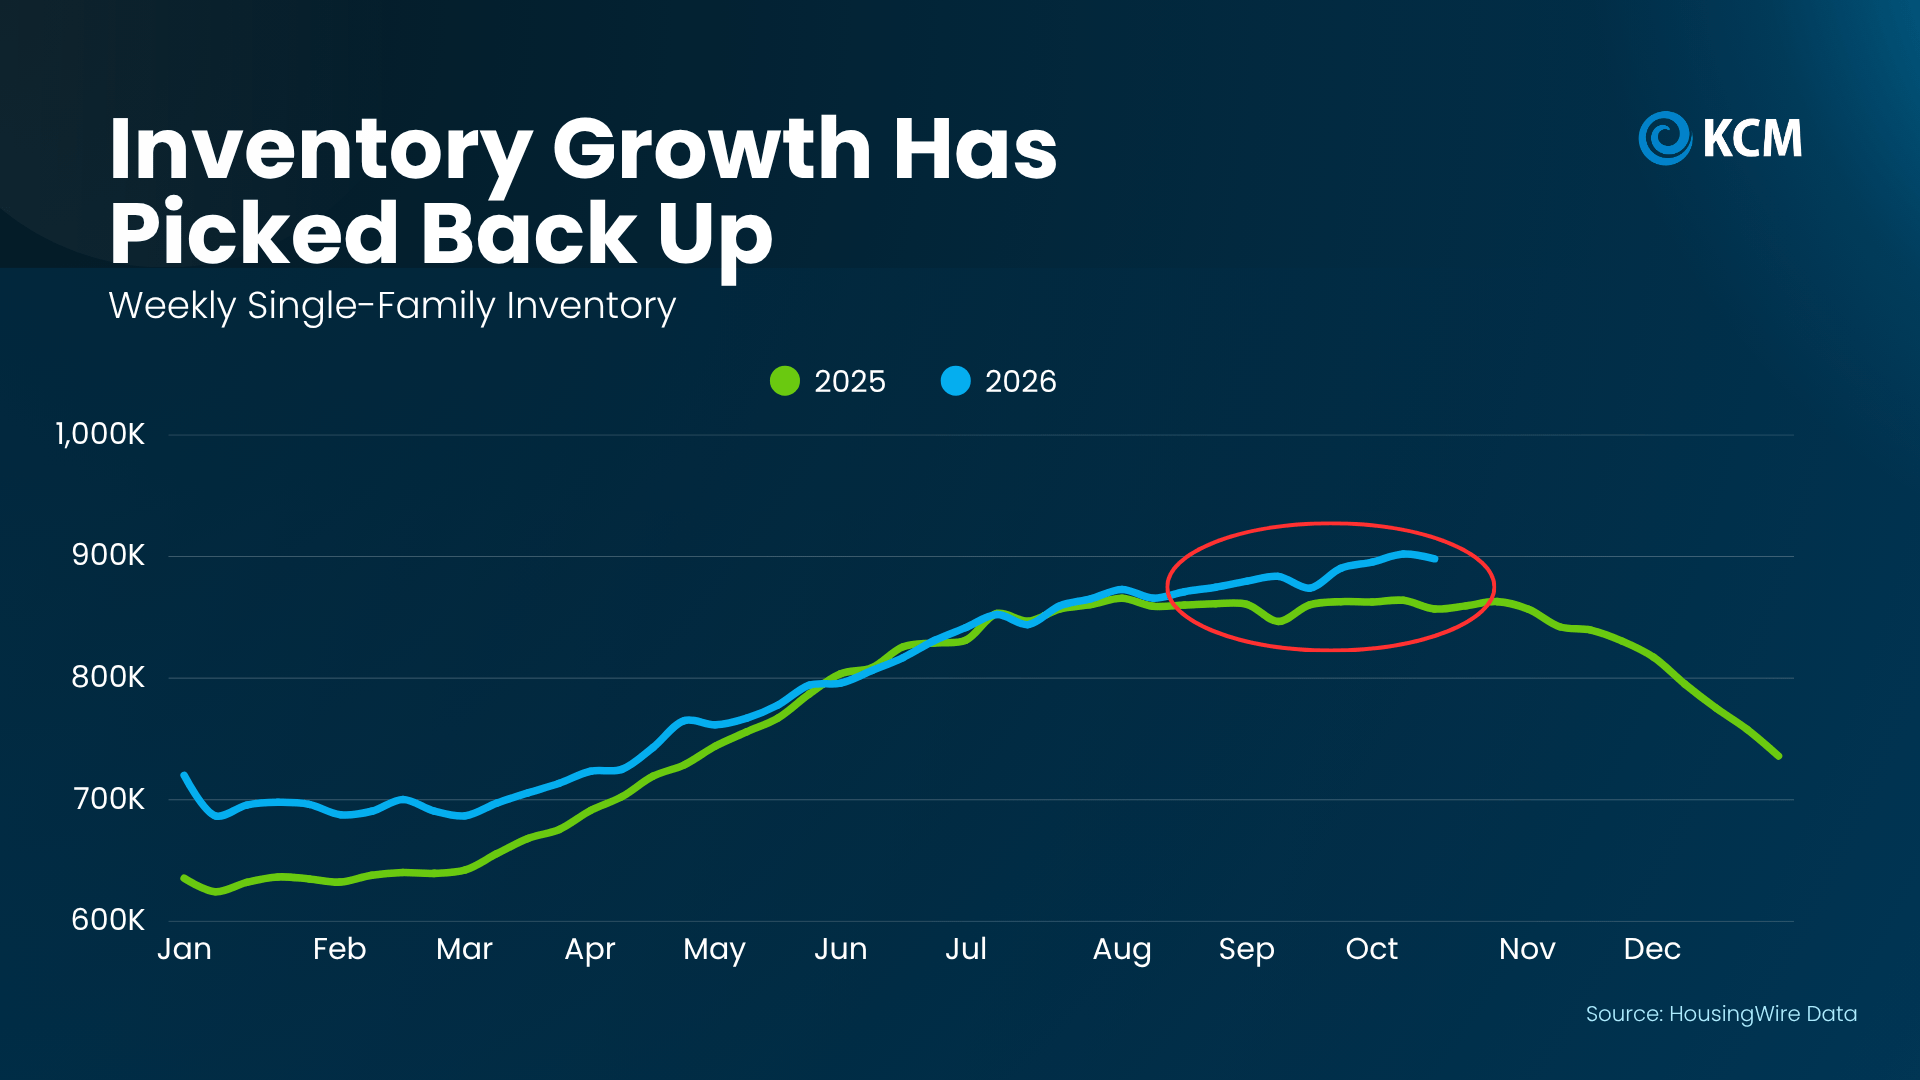
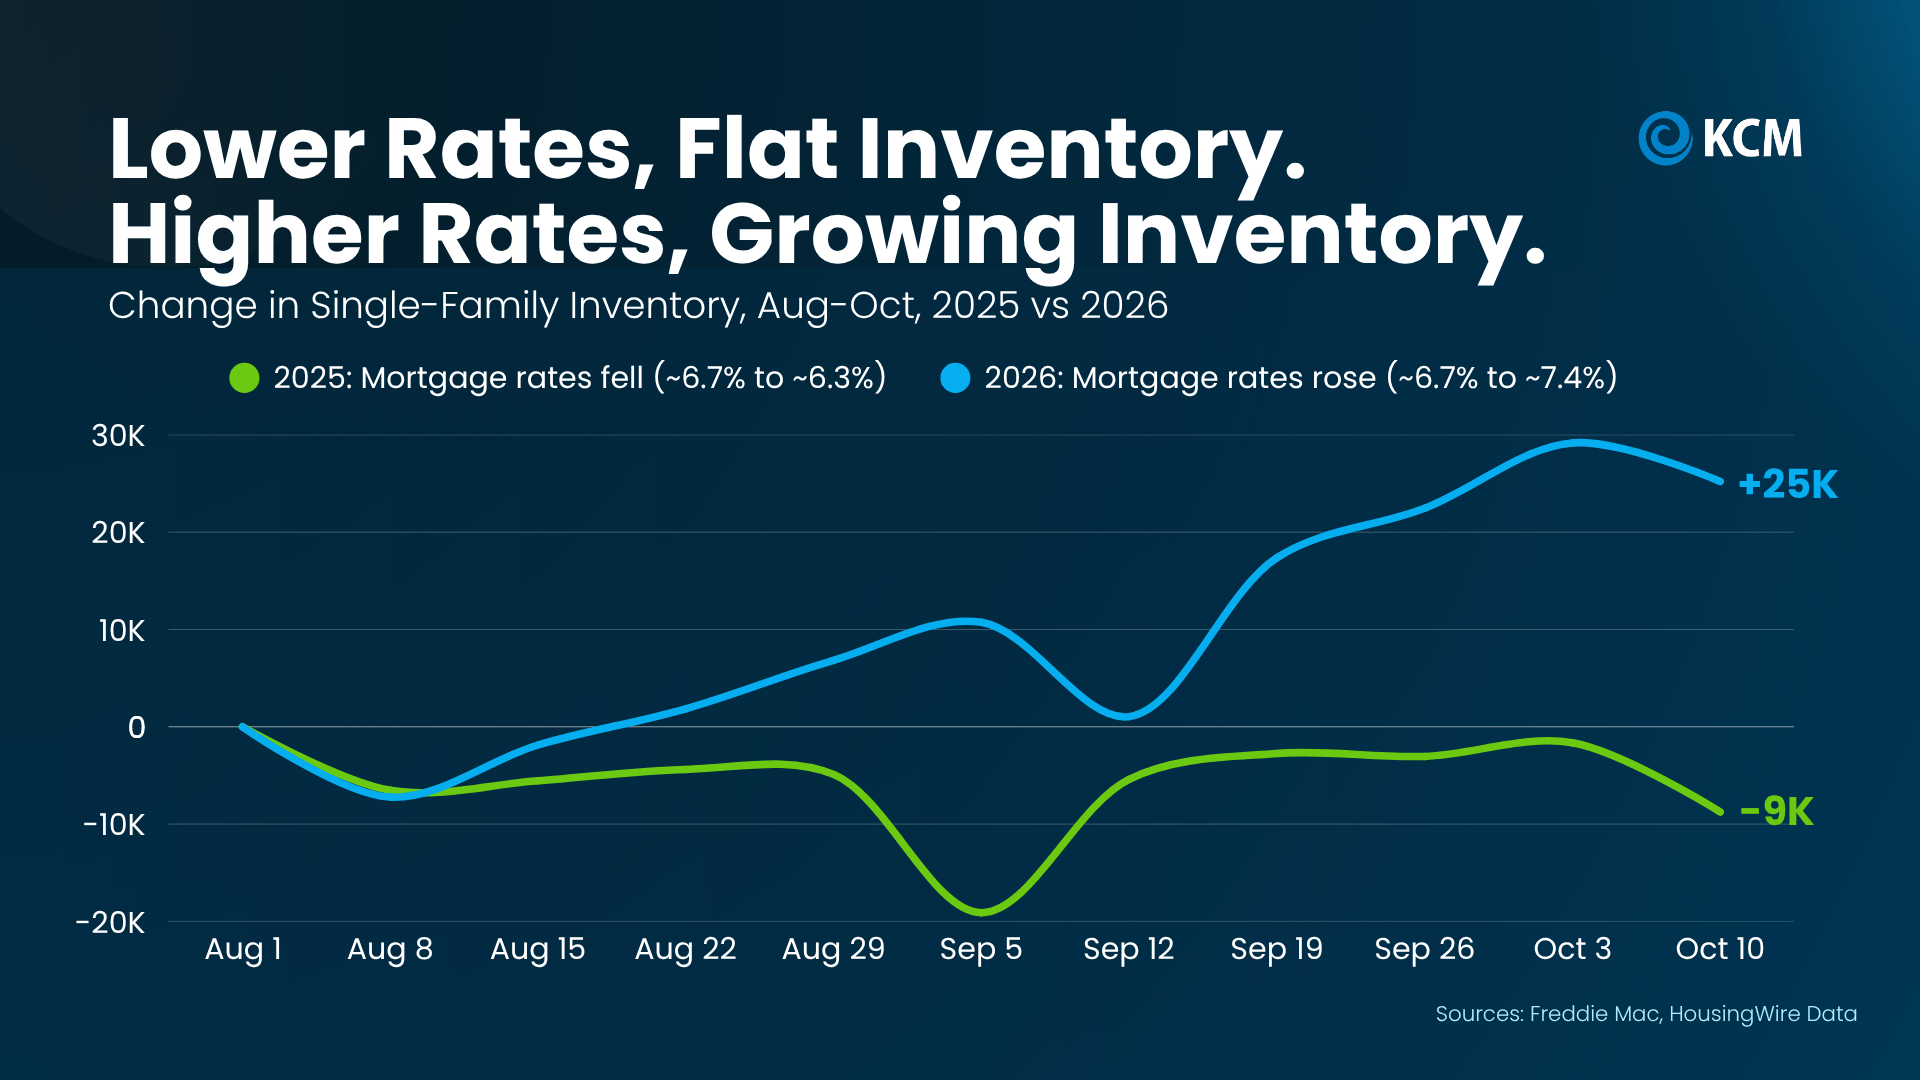
According to HousingWire Data, after inventory growth slowed down for most of the past year, it’s accelerated again in recent weeks. You can see that in the graph below. Just look at the blue line:

a graph of growth and growth

And what’s behind this shift might surprise you.

When rates rise, some buyers hit pause. That means fewer homes sell each week. And as those unsold homes stay on the market alongside new listings, the number available starts to grow (see the blue line in the graph below).

Here’s another way to look at it to make it even more obvious. The graph below shows the relationship between rates and inventory. Again, this year is the blue line. Last year? That’s the green.

With rates inching up this year, you can see inventory has grown by about 25k. But when rates went down this time last year, buyers jumped back in, and inventory actually dropped by about 9k.

a graph of growth and growth of a mortgage

Logan Mohtashami, Lead Analyst at HousingWire, explains how that’s flipped from 2025 to 2026:

“With mortgage rates over 7%, demand tends to soften and inventory rises . . .”

Homes Are Spending More Time on the Market

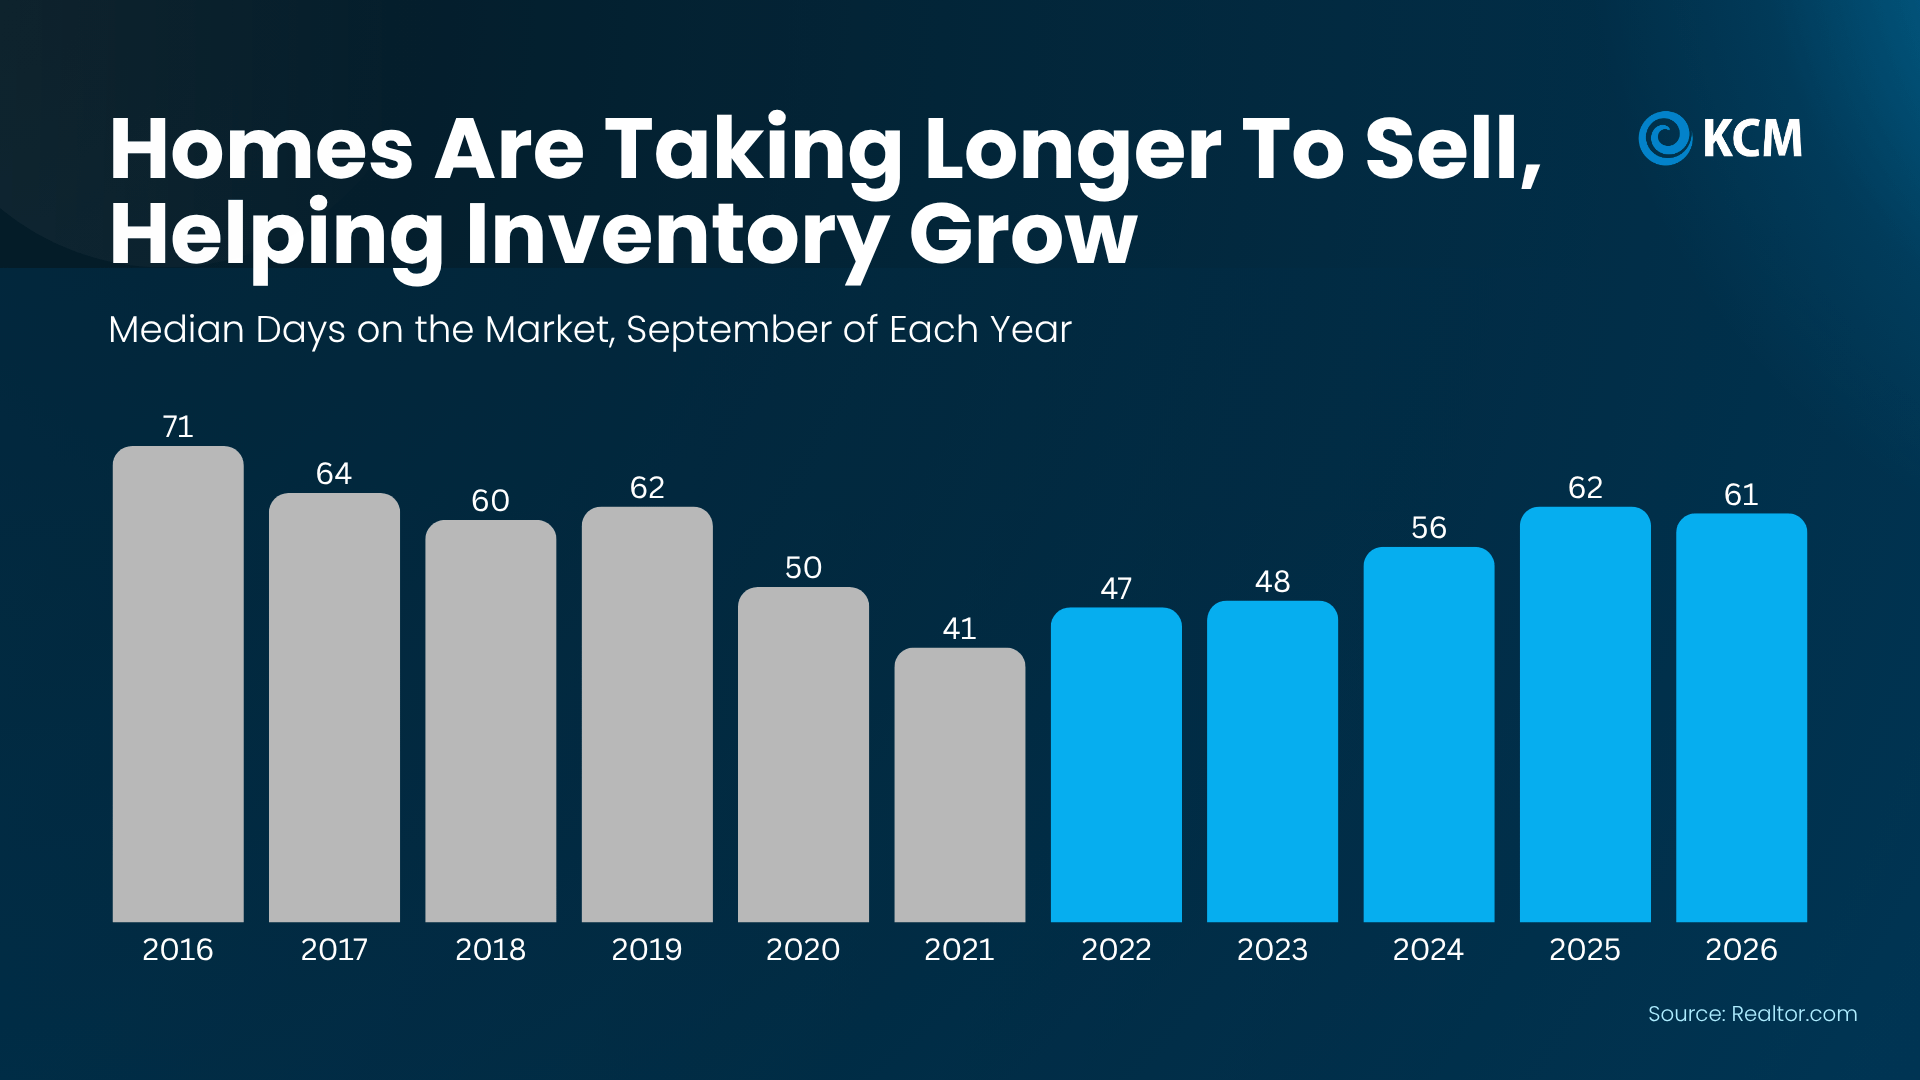
Here’s another metric that shows the impact rates are having: time on market. Data from Realtor.com shows the typical home spent 61 days on the market this September. Back in September 2021, it was just 41 days (see graph below):

a graph of sales growth

Here’s what that tells us. In 2021, when rates were low, more buyers were active, and homes sold fast. But now that rates are a bit higher, not as many buyers are interested, so it takes a bit longer to close a deal.

How To Make This Market Work for You

So, what does all of this mean for your plans? That depends on which side of the move you’re on:

If you’re buying, more homes for sale means more choices and less pressure to rush. And more room to negotiate too. A house that’s been sitting for a while could have a seller who’s more willing to talk – not just about price, but repairs, closing costs, or even helping buy down your mortgage rate.

That doesn’t mean every seller will play ball. But compared to the frenzy of a few years ago, buyers have more leverage now.

If you’re selling, the right strategy can make all the difference. Buyers have more homes to choose from, so making yours stand out is especially important. That starts with pricing it right from day one, making a great first impression, and working with your agent to highlight what makes your house worth choosing. Buyers are still buying and homes are still selling. The key is making sure yours is positioned to attract the right buyer.

The market hasn’t stopped. It’s just moving at a different pace. And whether you’re buying or selling, your strategy needs to move with it.

Bottom Line

In many places right now, inventory is growing and homes are taking a bit longer to sell. And that’s information that should shape the strategy you use going in.

Whether you’re buying or selling, connect with a local real estate agent to look at how long homes are taking to sell in your neighborhood, so your offer, or your price, fits today’s market.

Why Buyers Shouldn’t Overlook a Fall Move

Why Buyers Shouldn’t Overlook a Fall Move

Why Buyers Shouldn't Overlook a Fall Move Simplifying The Market

You’ve been waiting for something to change before you buy. It just might not be the thing you expected…

While everyone’s paying attention to mortgage rates, only the savviest buyers know that the changing season can start tipping things in their favor. 

Because every fall, buyers tend to get more to choose from, better prices, and more room to negotiate. And that’s why Hannah Jones, Senior Economist at Realtor.com, says:

“We always see that the best time to buy window usually falls in the early fall around October.”

And that’s exactly why, if you’ve been waiting for a better moment to buy, this season may be worth a closer look – even with rates where they are.

1. There Are More Homes To Choose From

One of the biggest frustrations buyers have had over the past few years has been a lack of choices. Fall tends to help with that.

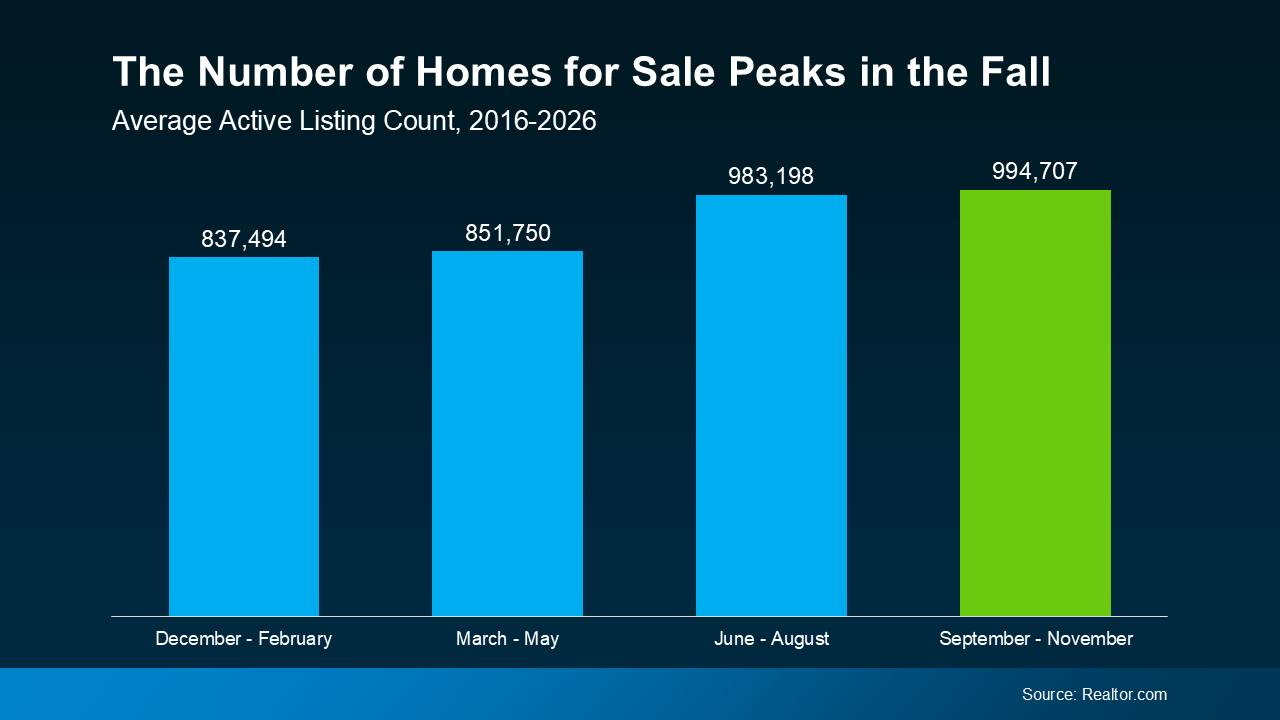
Based on seasonal trends, Realtor.com data shows there are typically more homes available for sale in September through November than during any other season of the year (see graph below):

a graph of a number of homesWhy does this happen? Homes that hit the market in spring and summer don’t all close right away. Some sit. New listings keep coming. And inventory builds as the year goes on.

By fall, you’re looking at the largest pool of available homes all year. That makes it easier to find one that works for your needs and your budget. And if anything, this should be more true this year. Rates that are higher for longer tend to help inventory grow even more.

More choices can mean fewer compromises. You’re more likely to find the right home, not just the one that happens to be available.

2. Asking Prices Start To Drop

Having more choices is great. But if every home is still priced too high, that only gets you so far. That’s where fall’s second advantage kicks in: asking prices start their seasonal decline. 

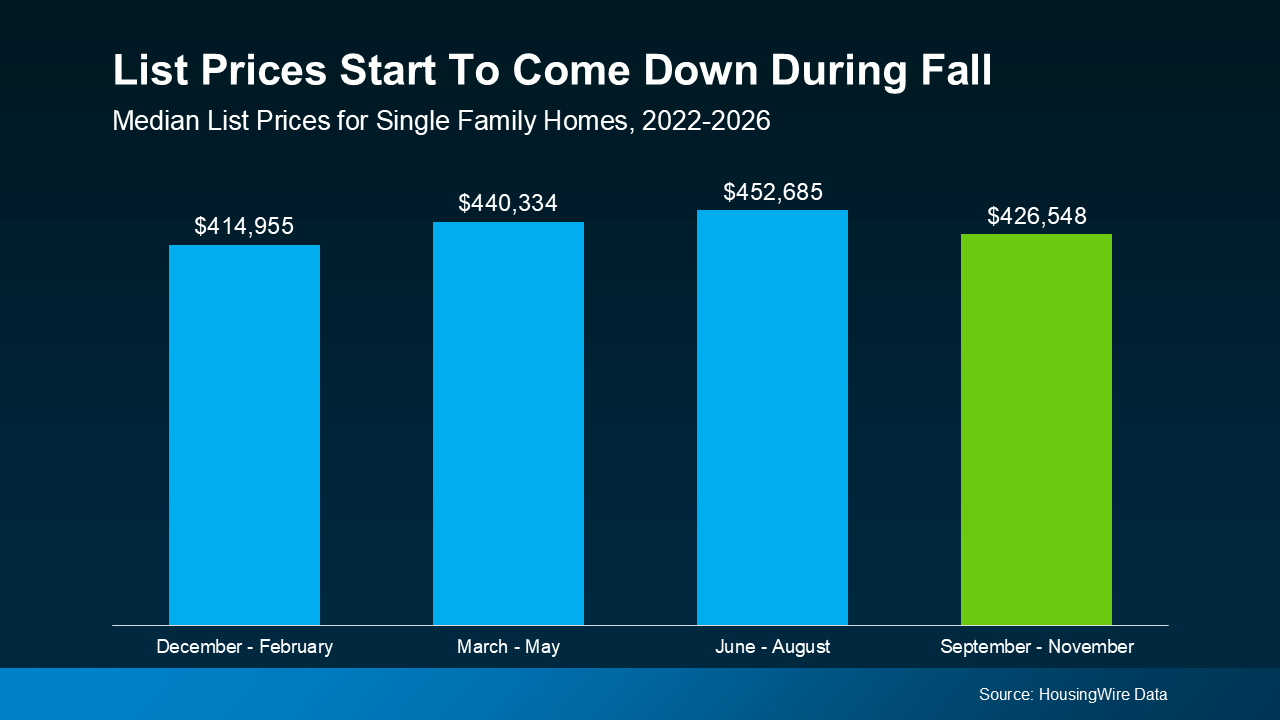
HousingWire data shows this trend over time (see graph below):

a graph of a number of blue and green barsIt works like this. Spring and early summer are when sellers feel the most confident because that’s when demand is typically strongest. So, many homeowners price their homes higher during those periods because of the uptick in demand.

But every year, like clockwork, that dynamic starts to change by fall. Buyer activity slows down as the weather cools off. So, sellers have to price a bit lower to try to draw buyers in. And that’s good for your bottom line.

3. More Sellers Are Willing To Negotiate

But fall doesn’t just bring more choices and lower asking prices. It also brings more sellers who are increasingly motivated to get a deal done. 

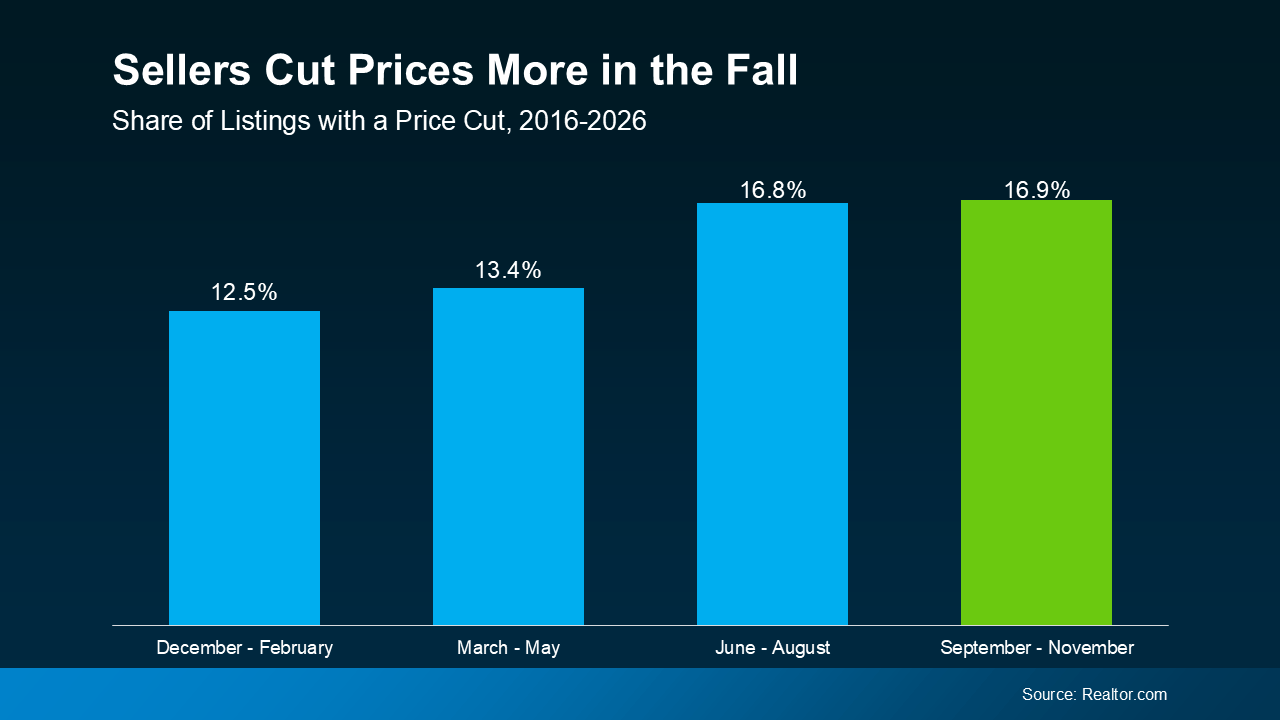
You can see it in the data. Most years, fall is when price cuts peak according to Realtor.com data (see graph below):

a graph of sales with numbers and text

While it’s not a big difference from summer, this fall you’ll have more negotiation power than you’d have if you wait until the first half of 2027. Here’s why. 

If a home is on the market in the fall, many sellers are eager to get it sold before the holidays. And since there are usually fewer buyers active in the fall, that often leads to another opportunity to snag a better deal. As the National Association of Realtors (NAR) explains:

“Less competition can lead to better deals. While homes are not selling as fast as during the summer, sellers may be more willing to negotiate.”

Even a small seller compromise here can make a meaningful difference for you. 

As an example, a 5% price drop on a $500,000 home is $25,000. That could mean you end up borrowing less, keeping more money in savings, having room in the budget for updates after you move in, or simply making the monthly payment feel more manageable.

Bottom Line

Of course, every market moves a little differently. But here’s what doesn’t change: Fall consistently buyers. More homes. Lower asking prices. Motivated sellers. 

If you’ve been waiting for your search to feel a little more doable, this season may be worth another look.

Have a quick conversation with a local agent about what’s happening in your market. That way you can find out whether this fall gives you opportunities you may not have had a few months ago.

Worried About a Housing Crash? The Numbers Tell a Calmer Story.

Worried About a Housing Crash? The Numbers Tell a Calmer Story.

Worried About a Housing Crash? The Numbers Tell a Calmer Story. Simplifying The Market

A recent survey from Talker Research asked Americans to pick one word to describe how 2026 has felt so far. The winner? Stressful. And honestly, there’s been a lot going on.

So, it’s understandable if you’ve been putting off buying or selling a home until things settle down. But you may be waiting on something that’s already happened. While everything else has felt shaky, the housing market has become one of the steadiest things out there. Look at the data.

Home Prices Have Leveled Out

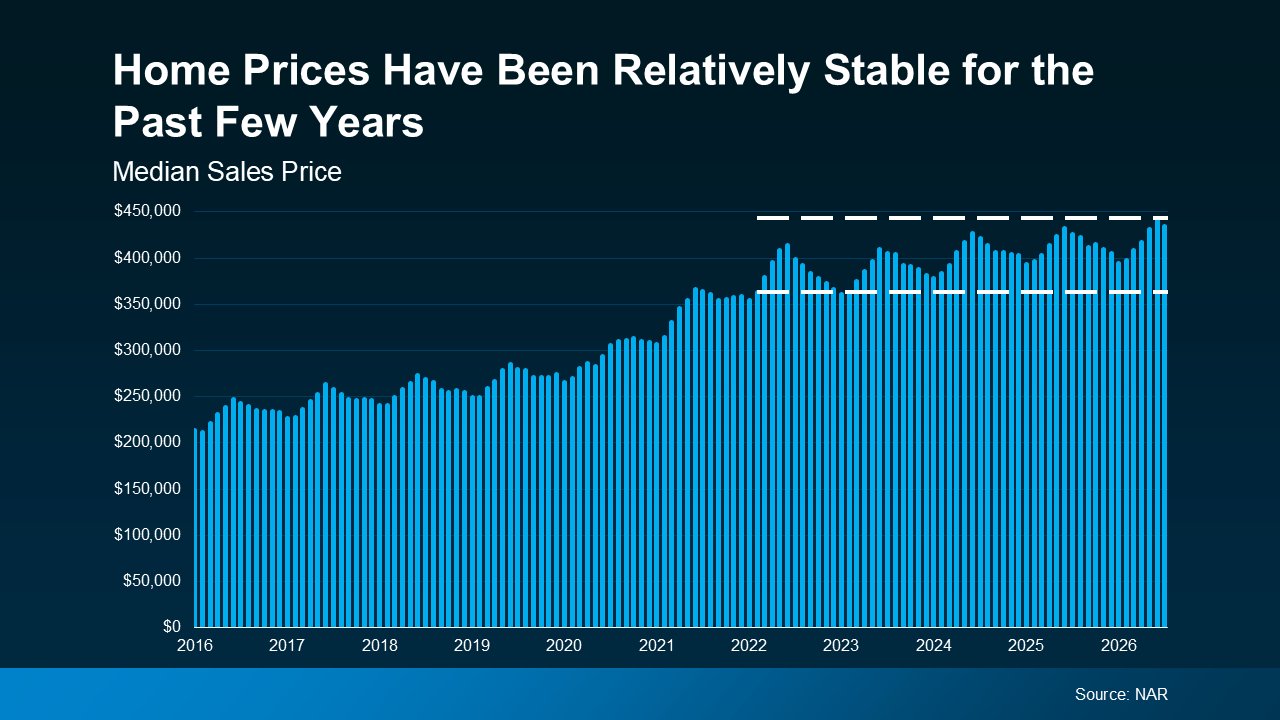
After years of fast increases, data from the National Association of Realtors (NAR) shows home prices have been remarkably steady for the past 4 years (see graph below):

a graph of blue linesAnd experts say that’s what to expect going forward, too. As Selma Hepp, Chief Economist at Cotality, explains:

“In 2026, we expect home prices to remain broadly stable, with modest appreciation at a national level.”

No wild swings. Just slow, steady growth. That’s a healthy market. Of course, that pace can vary a bit depending on where you live. But nationally, steady growth like this makes it easier to plan your budget, whether you’re buying or selling.

The Supply of Homes for Sale Has Steadied

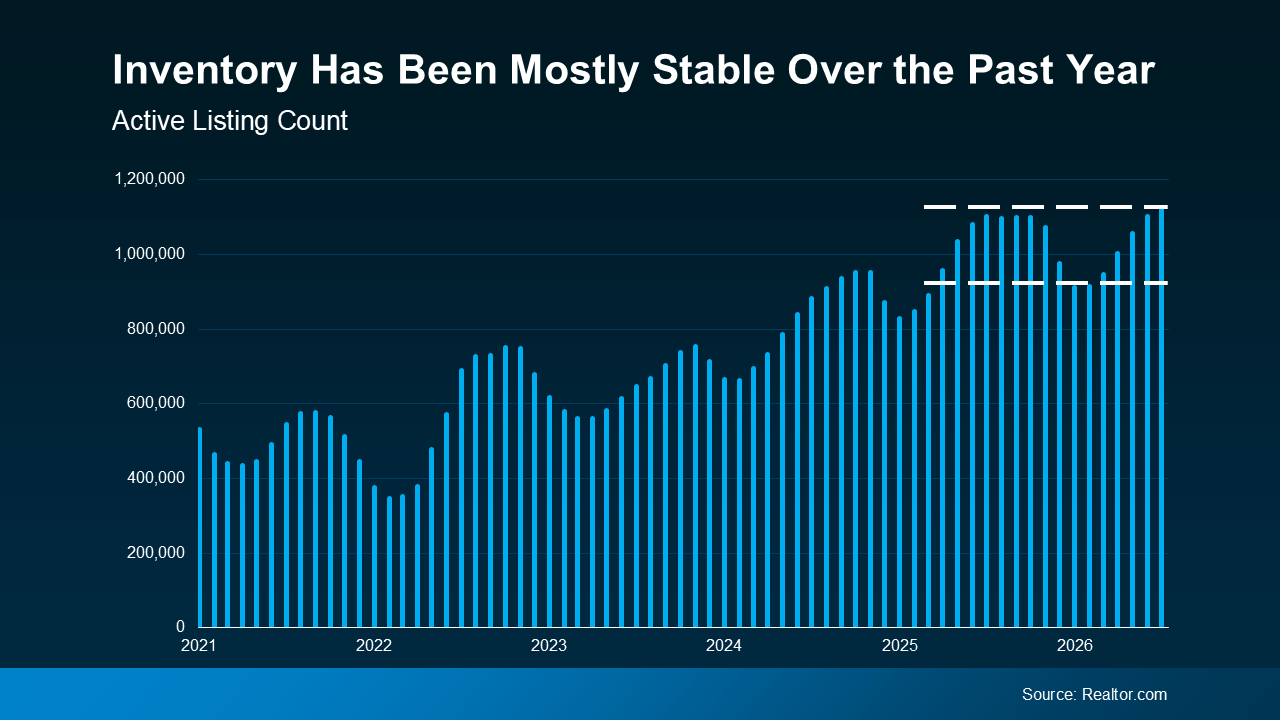
For years, the supply of homes for sale was a moving target. It dropped fast during the pandemic and has been climbing pretty reliably ever since. Now, that pace of growth has slowed down. According to Realtor.com, inventory today is very close to where it was this time last year (see graph below): 

a graph of blue linesThat’s helpful no matter which side you’re on. When the number of homes for sale isn’t changing much, you know what you’re walking into – how many options you’ll have as a buyer, and how much competition you’ll face as a seller.

Mortgage Rates Found Their Range

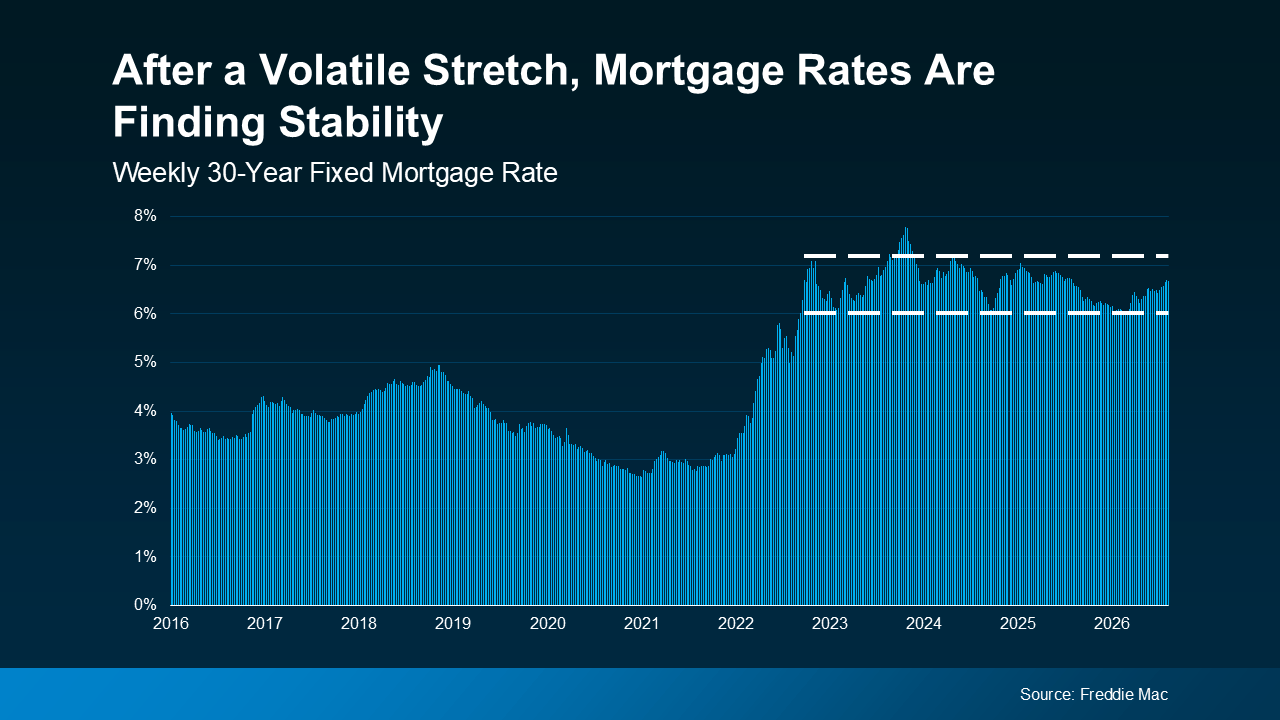
Yes, rates jumped dramatically back in 2022. But since then, Freddie Mac data shows they’ve stayed between 6% and 7% for the better part of the last 3 or so years (see graph below):

a graph of a graph of a graph of a graph of a graph of a graph of a graph of a graph of a graph of a graph of a graph of a graph of a graph ofYes, there was one brief spike above that threshold, but overall, rates have stayed in that range for a while now. That predictability helps when you’re planning a move. 

And now that this seems to be a longer-term trend, people have accepted it as the new normal. Buyers have gotten comfortable purchasing in that range, and sellers have gotten just as comfortable listing in it.

That comfort’s important because when both sides know what to expect, they keep making moves. In other words, the market isn’t frozen waiting for something to change. It’s moving calmly.

Bottom Line

The rest of the world may feel unpredictable right now, but the housing market doesn’t have to. Prices, inventory, and rates have all found solid ground.

If stability is what you’ve been waiting for, it’s already here. Connect with a local real estate agent if you want to talk through what that means for your move.

Higher Rates Could Actually Help Housing Supply – Here’s How.

Higher Rates Could Actually Help Housing Supply – Here’s How.

Higher Rates Could Actually Help Housing Supply – Here’s How. Simplifying The Market

You may have heard the number of homes for sale isn’t growing like it was. And maybe that has you worried you won’t find a home you love when it’s time to make your move.

But that may be about to change. Here’s why your pool of options may actually start ticking back up again.

Growth Has Slowed, But It Hasn’t Stopped

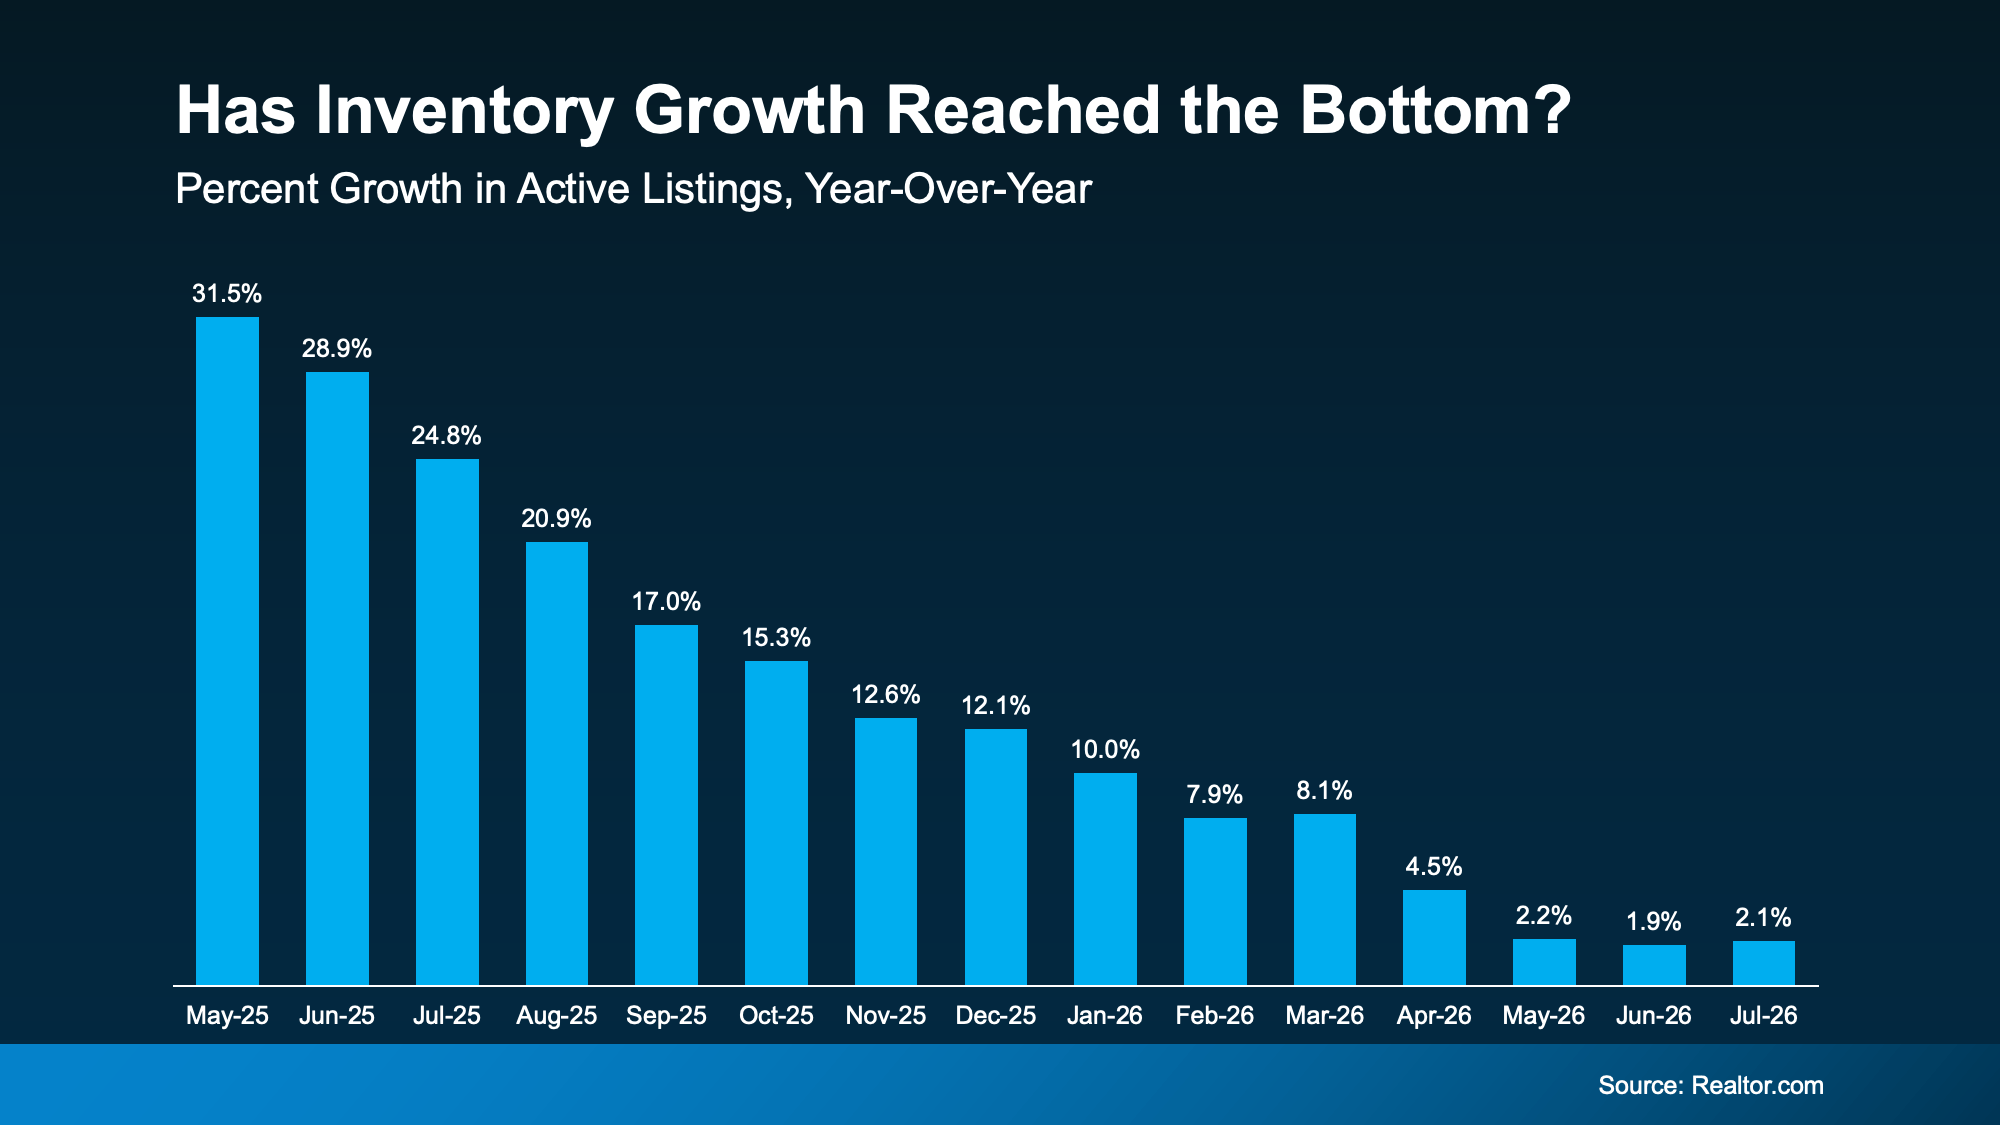
Active listings were up 2.1% year-over-year in July, according to Realtor.com. Back in January, inventory was up 10%. And in May of 2025, it was up 31.5%. So, growth has cooled off a lot over the last year.

The past 3 months, though, have all seen inventory growth land in roughly the same range, which is a sign this slowdown may be nearing its floor (see graph below):

a graph of growth in a blue background

So, what does that mean for you?

Homes are still coming onto the market. Every single one of these bars shows a period where inventory grew. So, don’t be discouraged or let this make you think you’re out of options. Plus, we’ve seen more stability in the numbers lately, which is a good sign.

The Most Homes for Sale Since 2019

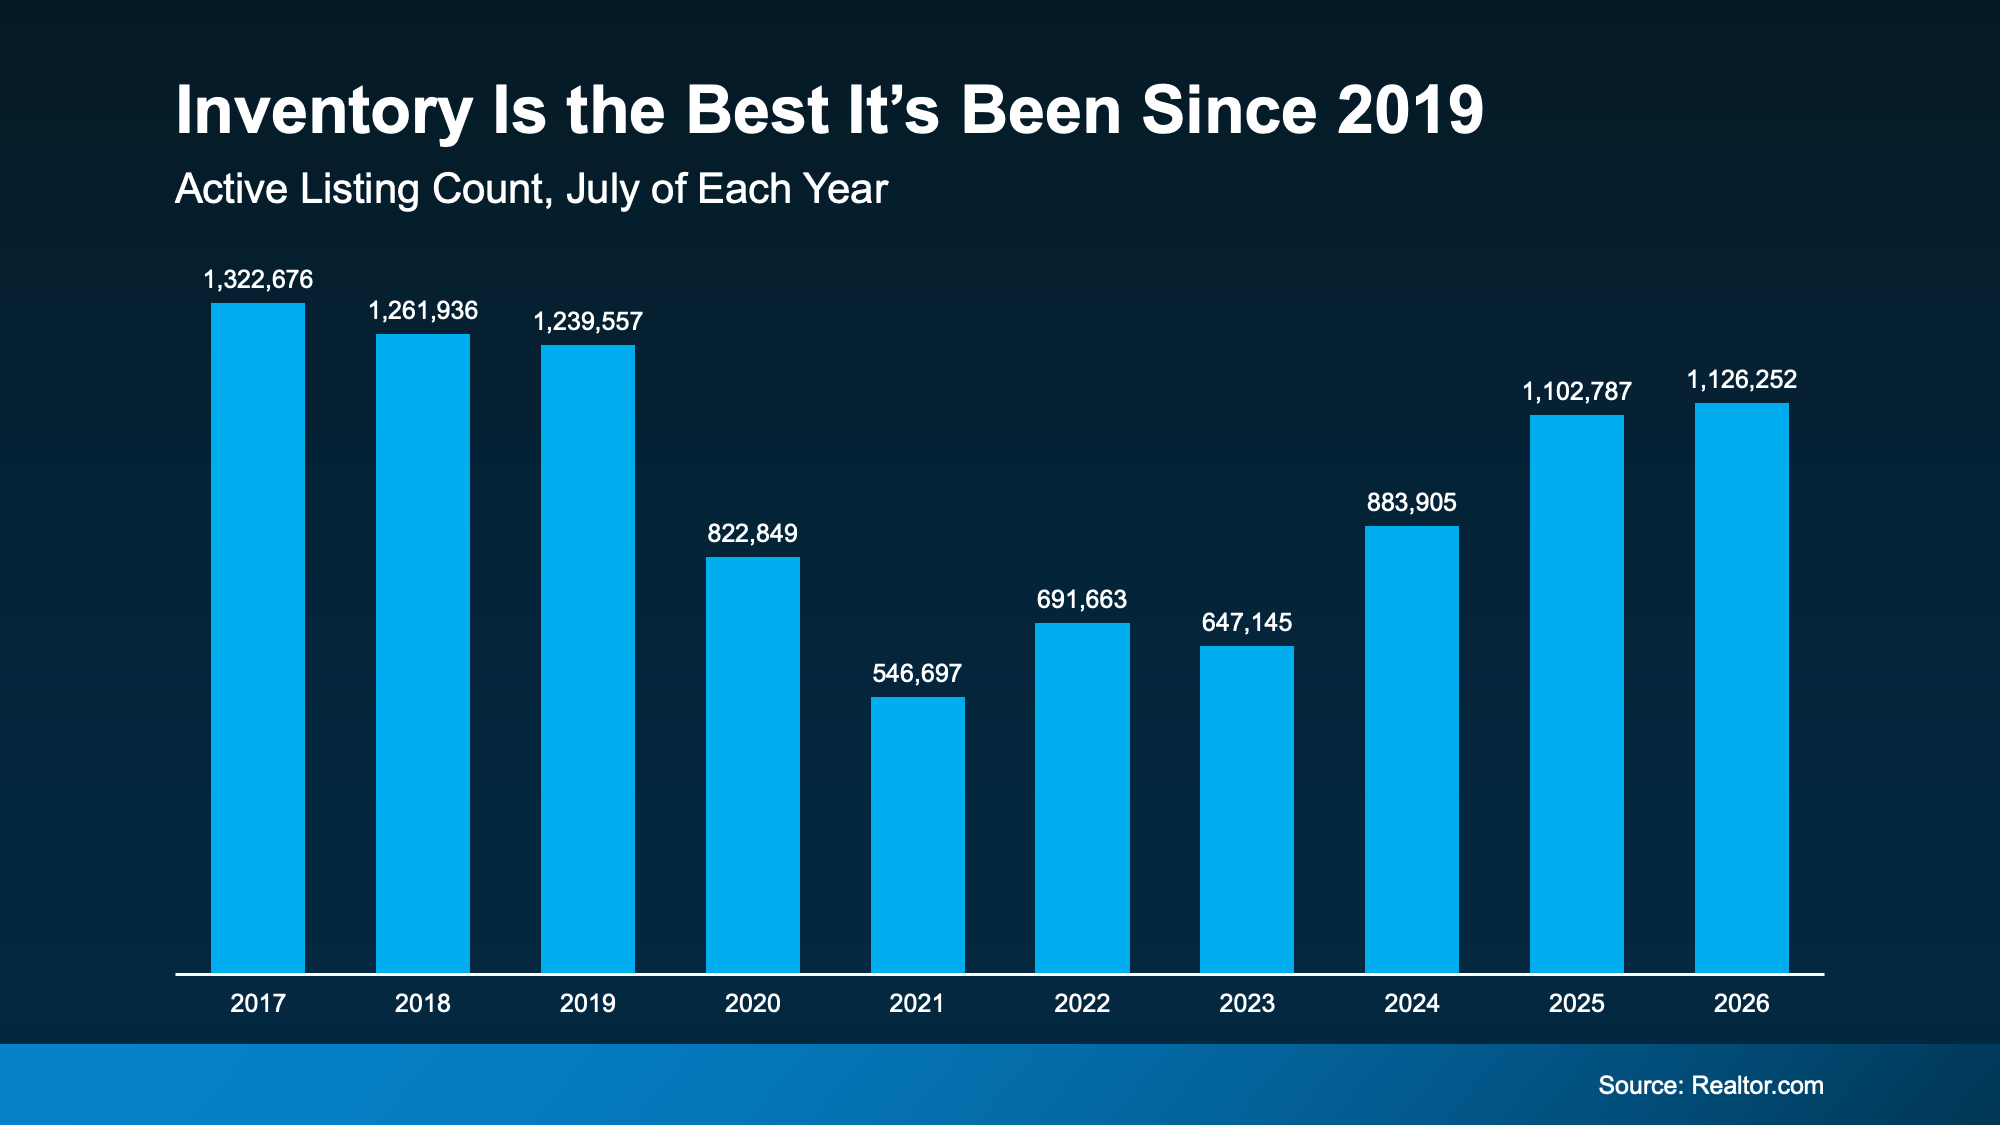
Compared to the rock-bottom lows of 2021, inventory has climbed back substantially. Nationally, the number of homes for sale has been up year-over-year consistently now for 33 months. And inventory has almost doubled in just a few years. So don’t get too hung up on the pace of that increase.

This July was actually the best July for inventory since 2019 (see graph below):

a graph of blue bars with white text

Now, the market still needs about 150k listings to get back to pre-pandemic levels, but things are quickly approaching normal. And experts think we may even be back to 2019 levels by the end of this year, even with the slowdown we’ve already seen.

And that’s thanks to one unlikely factor: mortgage rates. 

Why Higher Rates May Actually Help Inventory Grow

It works like this. When mortgage rates climb, inventory tends to climb with them. As Mike Simonsen, Chief Economist at Compass, explains:

“When rates rise; inventory rises. When rates fall; inventory falls. So, from July last year to March this year, rates ease lower and all the inventory growth of the past several years evaporated. If rates move higher from here or stay elevated for [a] longer period of time, then we should expect supply to build again.”

Well, rates are expected to hold in the mid-to-upper 6% range for a while longer, and Realtor.com‘s latest forecast has inventory ending 2026 up 3.6% year-over-year.

That means 2 things:

  • Inventory growth is forecast to pick up a little bit throughout the rest of the year.

  • And, inventory is projected to close the year at a historically normal level, right about where it stood at the end of 2019.

For buyers, that’s a win. Even if today’s rates aren’t your favorite, they’re helping the number of homes on the market to grow. And more homes for sale means more choices, more room to negotiate, and less pressure to rush your search.

Bottom Line

The number of homes for sale is growing slowly but surely, and that means more options for your move. Want to see what’s available in your area? Reach out to a local real estate agent.
Pin It on Pinterest