Should You Wait for Lower Rates?

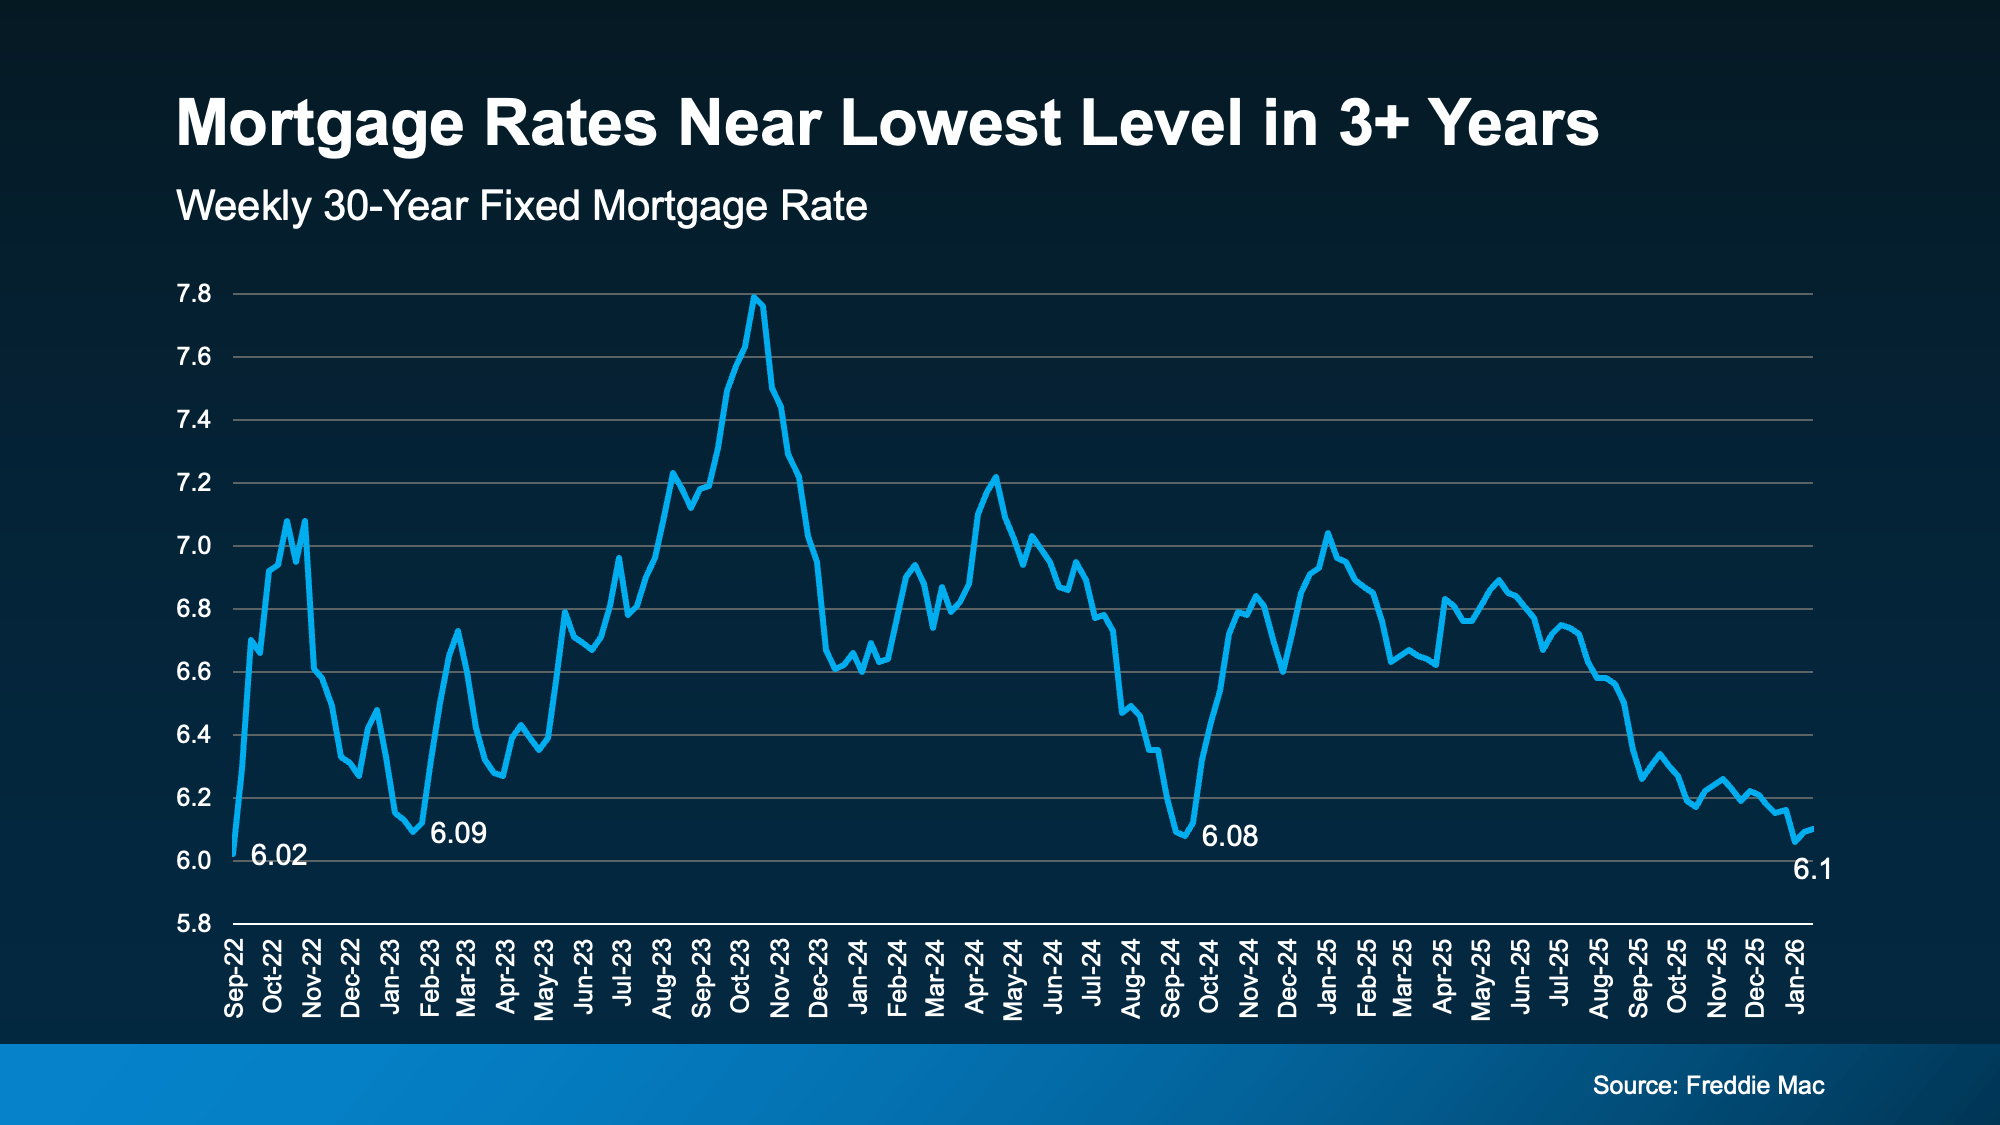
Mortgage rates have already dropped into the upper 5s twice this year. But after just a few days, they ticked back up into the low 6% range. If you saw that and thought, “Great. I missed it,” you’re not the only one.
A lot of buyers are treating the 5s like some kind of magic number. As if moving from 6.1% to 5.99% suddenly changes everything. And from a mindset perspective, it does feel different.
But here’s the part most people don’t actually run the math on.
The Payment Difference Isn’t What You Think
Let’s say you’re looking at a $500,000 home loan. At 6.1%, generally speaking, your principal and interest payment is roughly $3,030 per month. At 5.9%, it’s about $2,966 per month.
That’s a difference of only $64 a month.
Not $300.
Not $500.
Sixty dollars.
Let that sink in for just a moment.
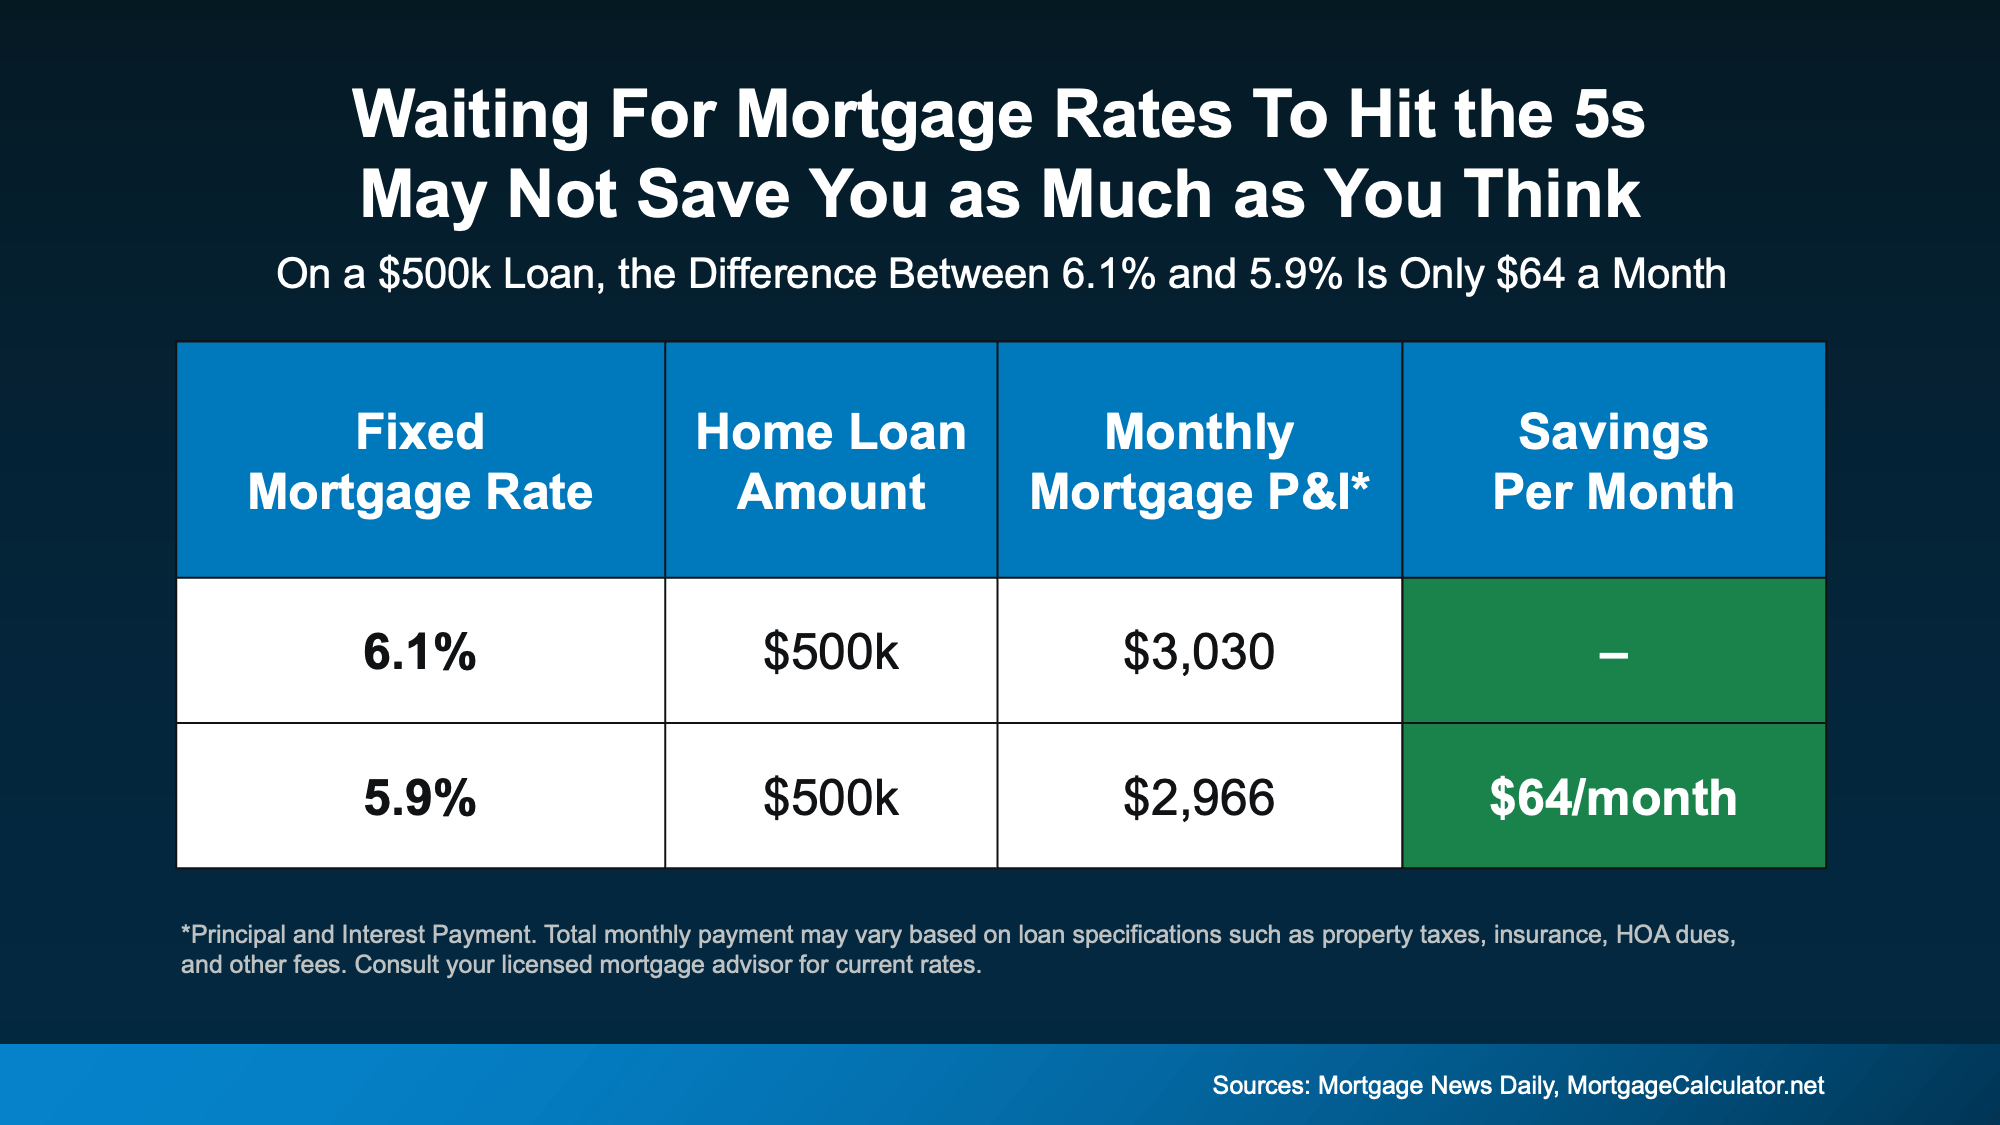 Yes, over time that $64 a month can add up. But it’s far from the dramatic swing many buyers imagine when they say they’re “waiting for the 5s.”
The psychological impact of seeing a 5 in front of your rate can feel big. The financial impact? It might be something you don’t even notice when it’s all said and done.
Experts Aren’t Predicting a Big Drop
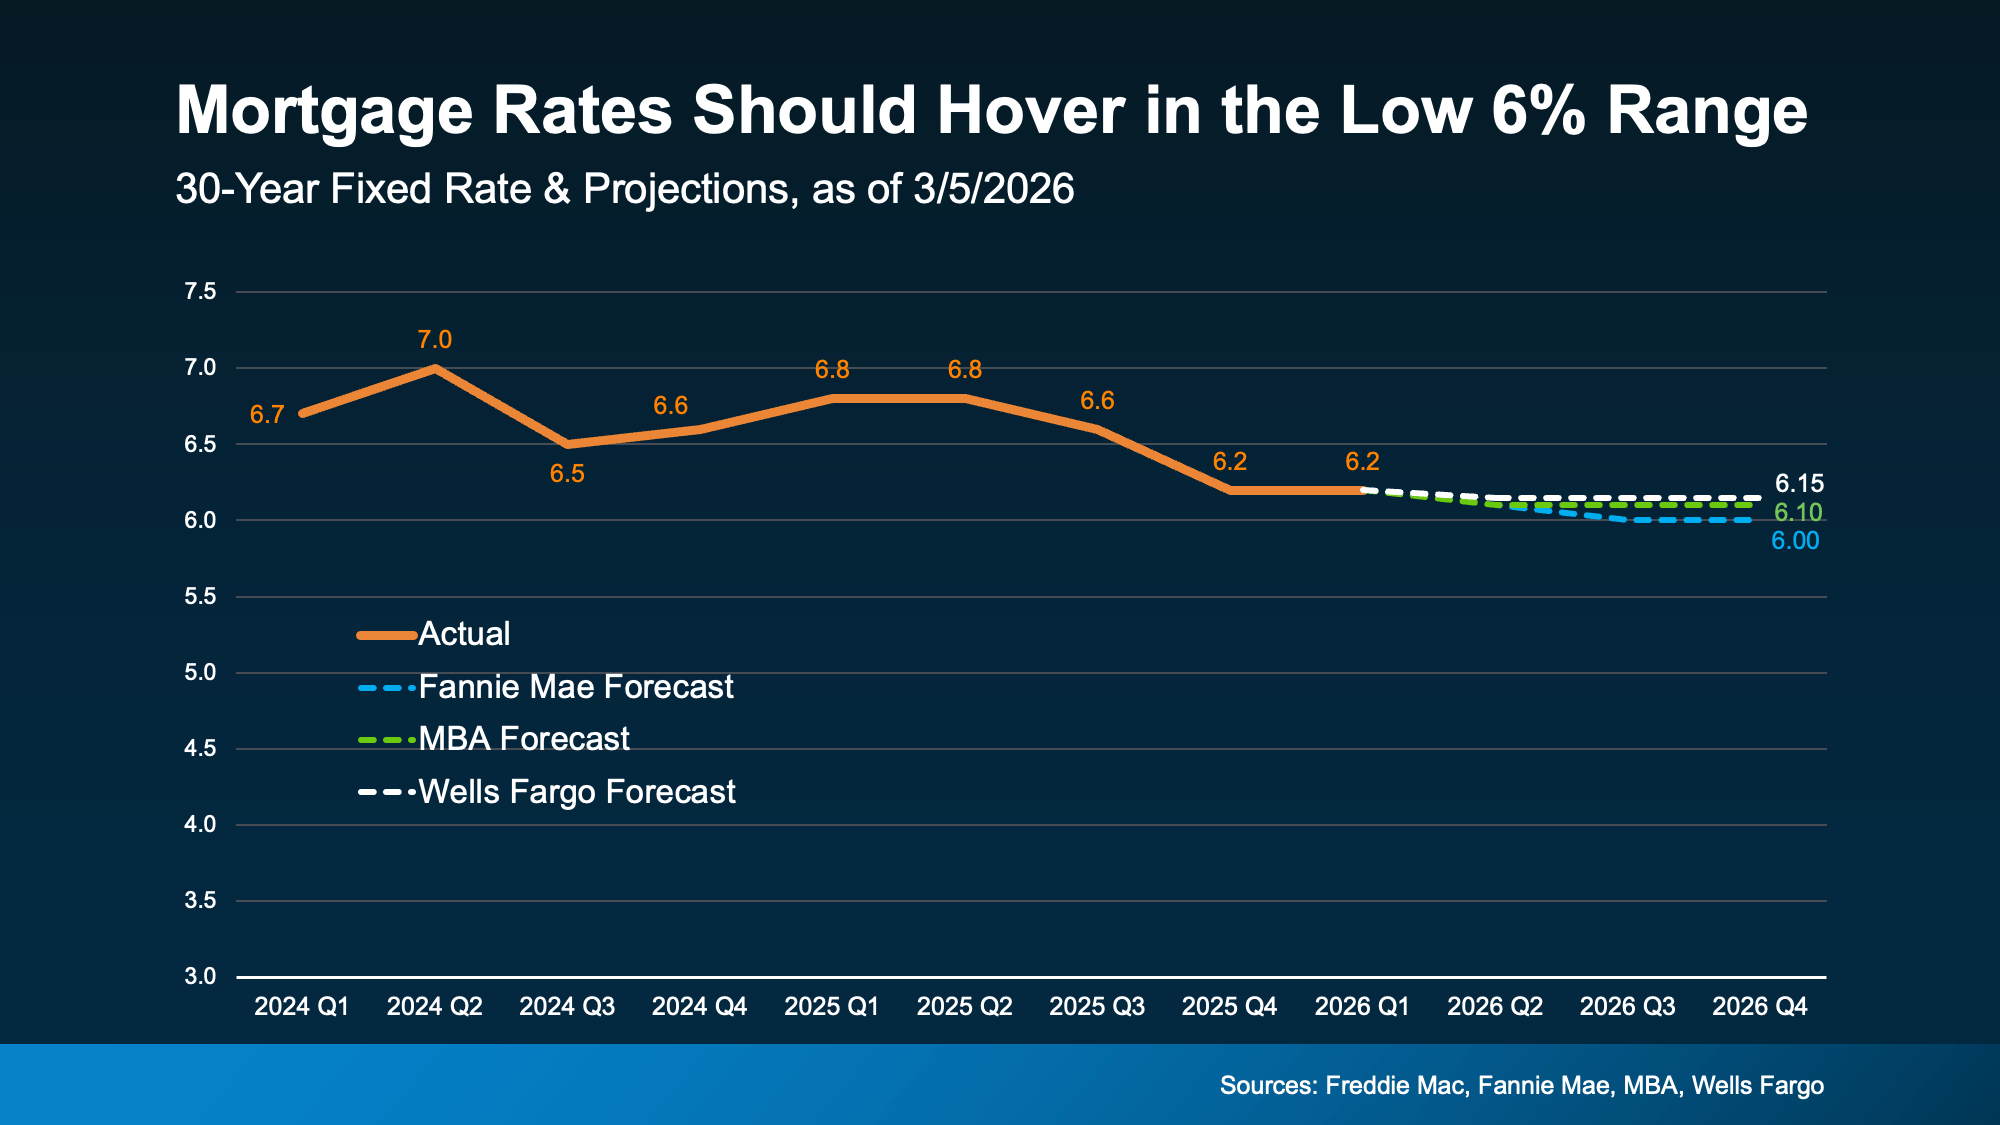
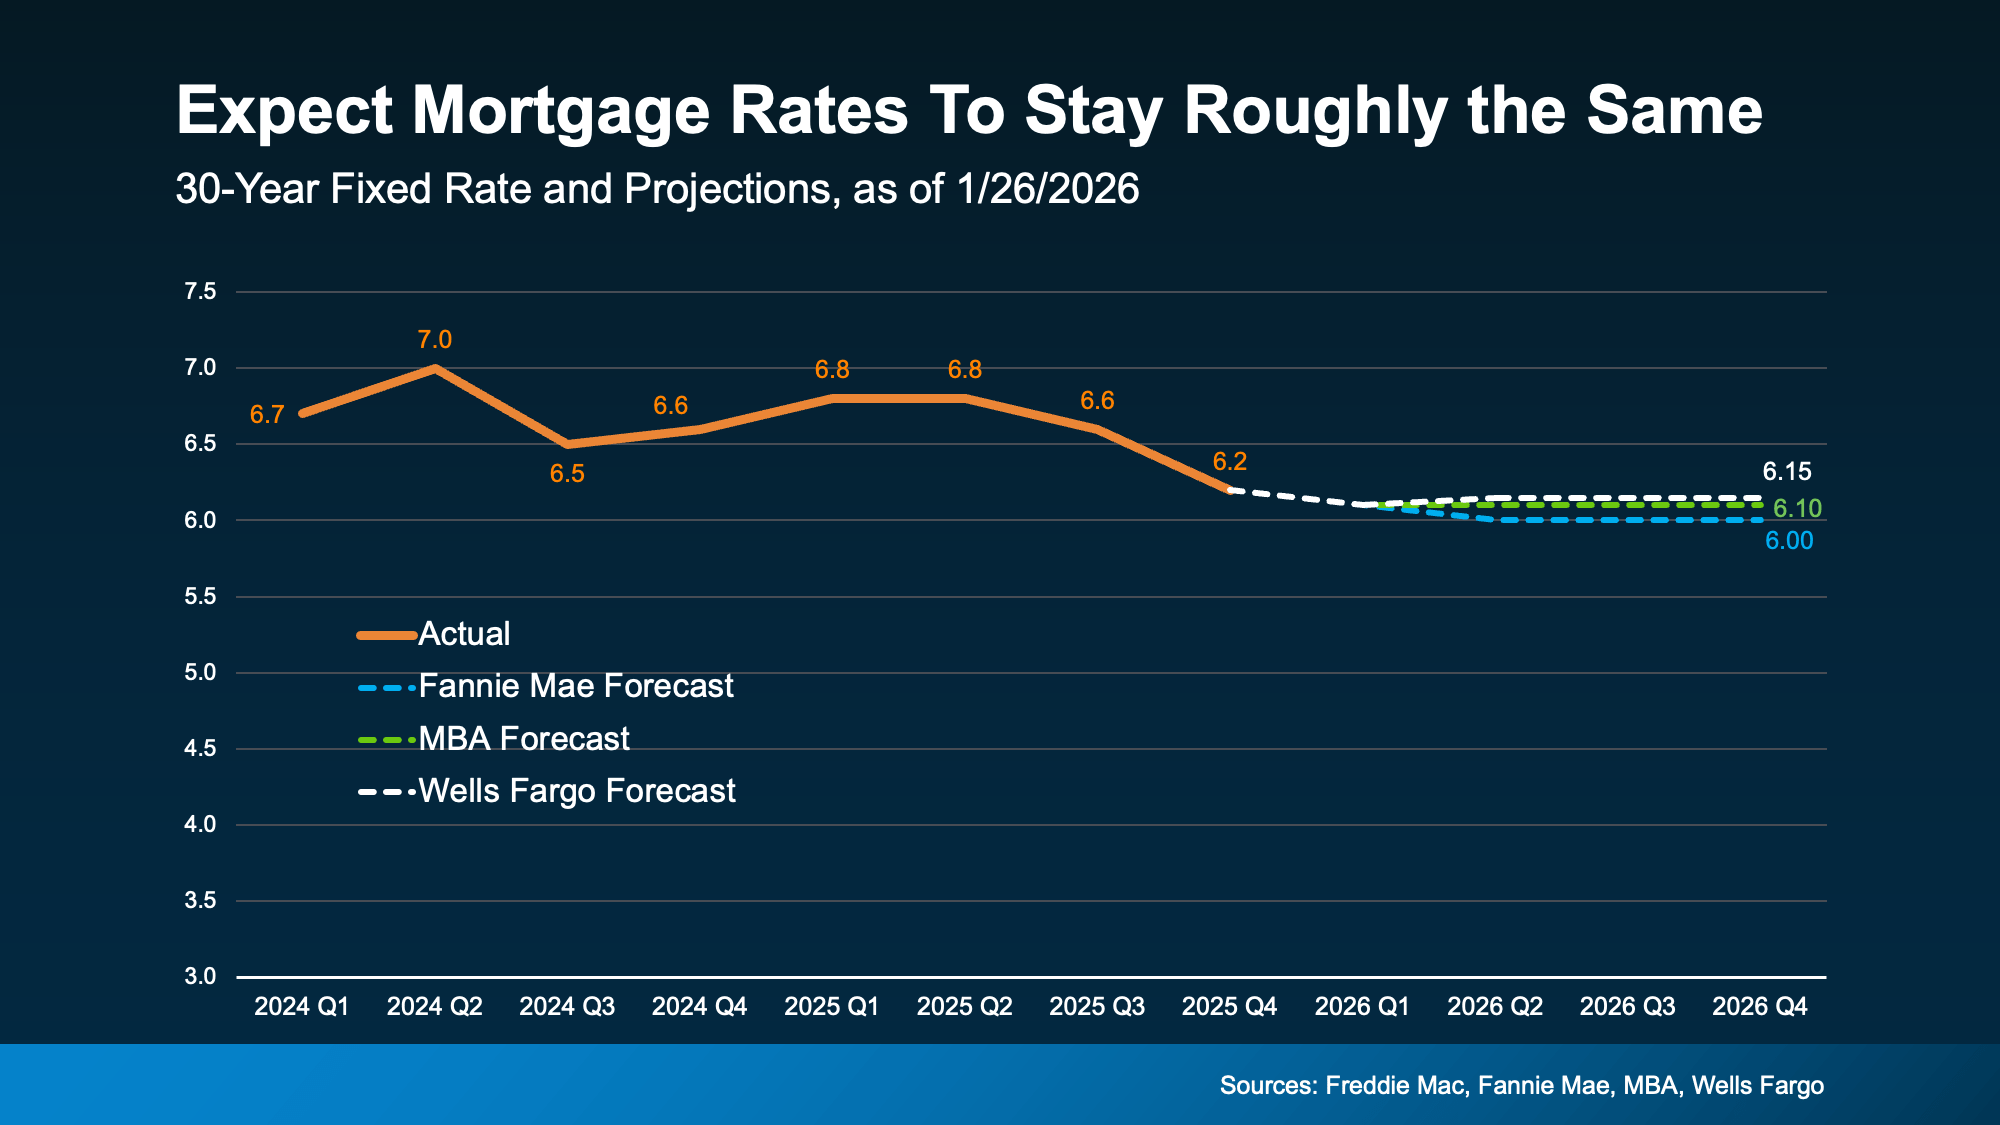
Another important piece to think about: most housing economists aren’t forecasting a long-term return to 5% territory anytime soon.
While rates will move up and down, likely hitting the high 5s here and there, the broader expectation is for mortgage rates to hover in the low 6% range this year, not stay in the 5’s or decline much more.
 While it certainly could happen, the reality is, waiting for a deep drop may not deliver the payoff you’re hoping for, if you’re holding out
The Bigger Question to Ask
Instead of asking, “Did I miss the 5s?” A better question is: “Does today’s payment work for me?”
If the monthly payment fits comfortably in your budget, and you’ve found a home that meets your needs, the difference between 6.1% and 5.9% likely isn’t the deciding factor. It might be one of them, but it shouldn’t be everything.
And remember, mortgage rates aren’t permanent. If they drop meaningfully later, refinancing is always an option. But you can’t refinance a home you didn’t buy.
Waiting Might Feel Safe, But It Isn’t Always Strategic
It’s natural to want the best possible rate. Everyone does. But sometimes buyers overestimate how much a rate in the high 5s will change things in today’s market.
Don’t miss the fact that rates have already come down. A year ago, they were in the 7s. Now? They’re hovering in the low 6s. And for a lot of people, that percentage point difference that’s already here is the real game changer.
If you paused your plans when rates were higher, now may be the right time to re-run your numbers. Not because rates are “perfect.” But because the monthly payment math might work better than you think, even with rates in the low 6s.
Before assuming you’ve missed your moment, take another look at the numbers.
You may find it never disappeared.
Bottom Line
If you’ve been sitting on the sidelines waiting for that magic five number for rates, that strategy may not pay off as much as you’d expect.
Connect with an agent or lender so you can double check the math at your price point. You may realize payments are already within your range.


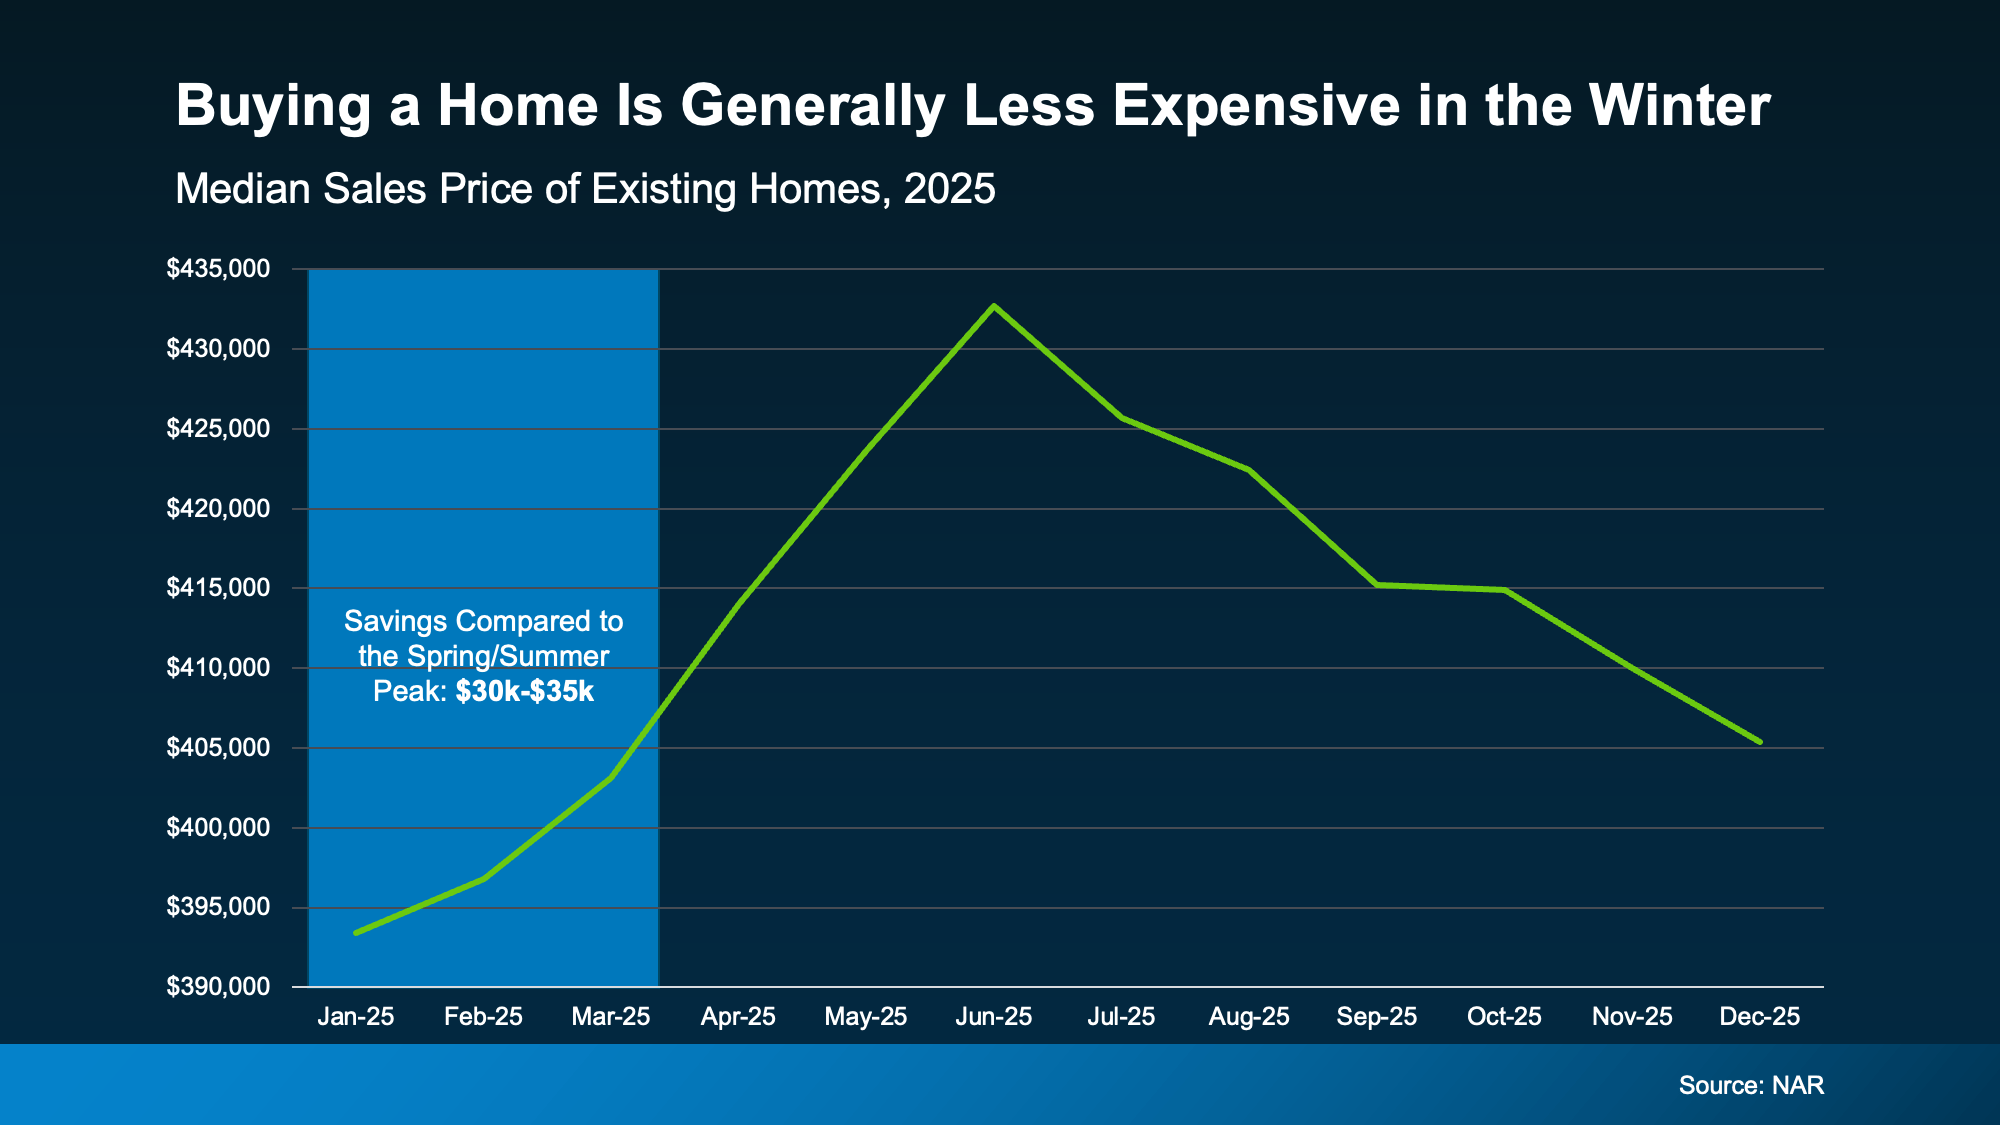
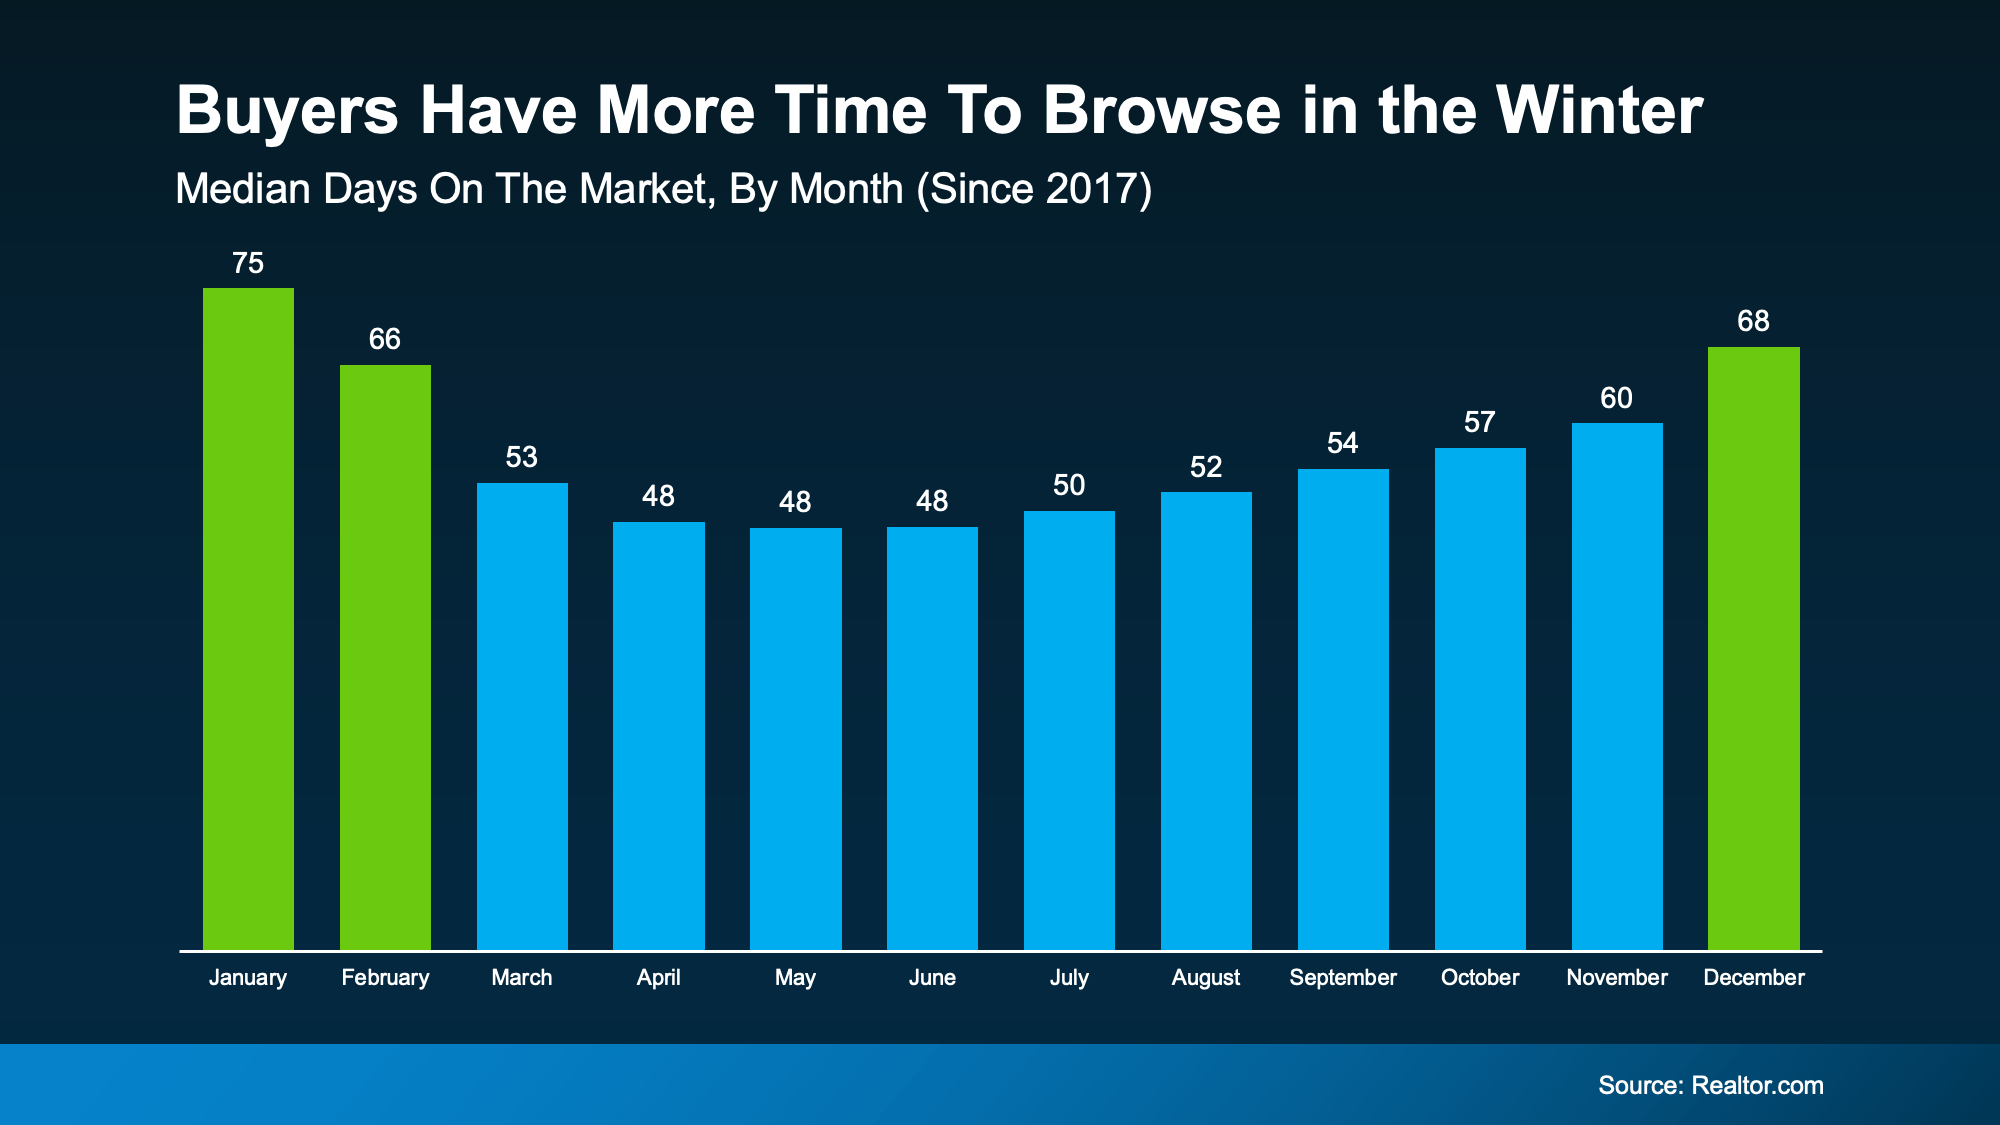 Homes sell faster in the spring, and slower in the winter. And that can be a worthwhile perk for buyers who want to get ahead before their decisions start to feel rushed.