Higher Rates Could Actually Help Housing Supply – Here’s How.

Higher Rates Could Actually Help Housing Supply – Here’s How.

Higher Rates Could Actually Help Housing Supply – Here’s How. Simplifying The Market

You may have heard the number of homes for sale isn’t growing like it was. And maybe that has you worried you won’t find a home you love when it’s time to make your move.

But that may be about to change. Here’s why your pool of options may actually start ticking back up again.

Growth Has Slowed, But It Hasn’t Stopped

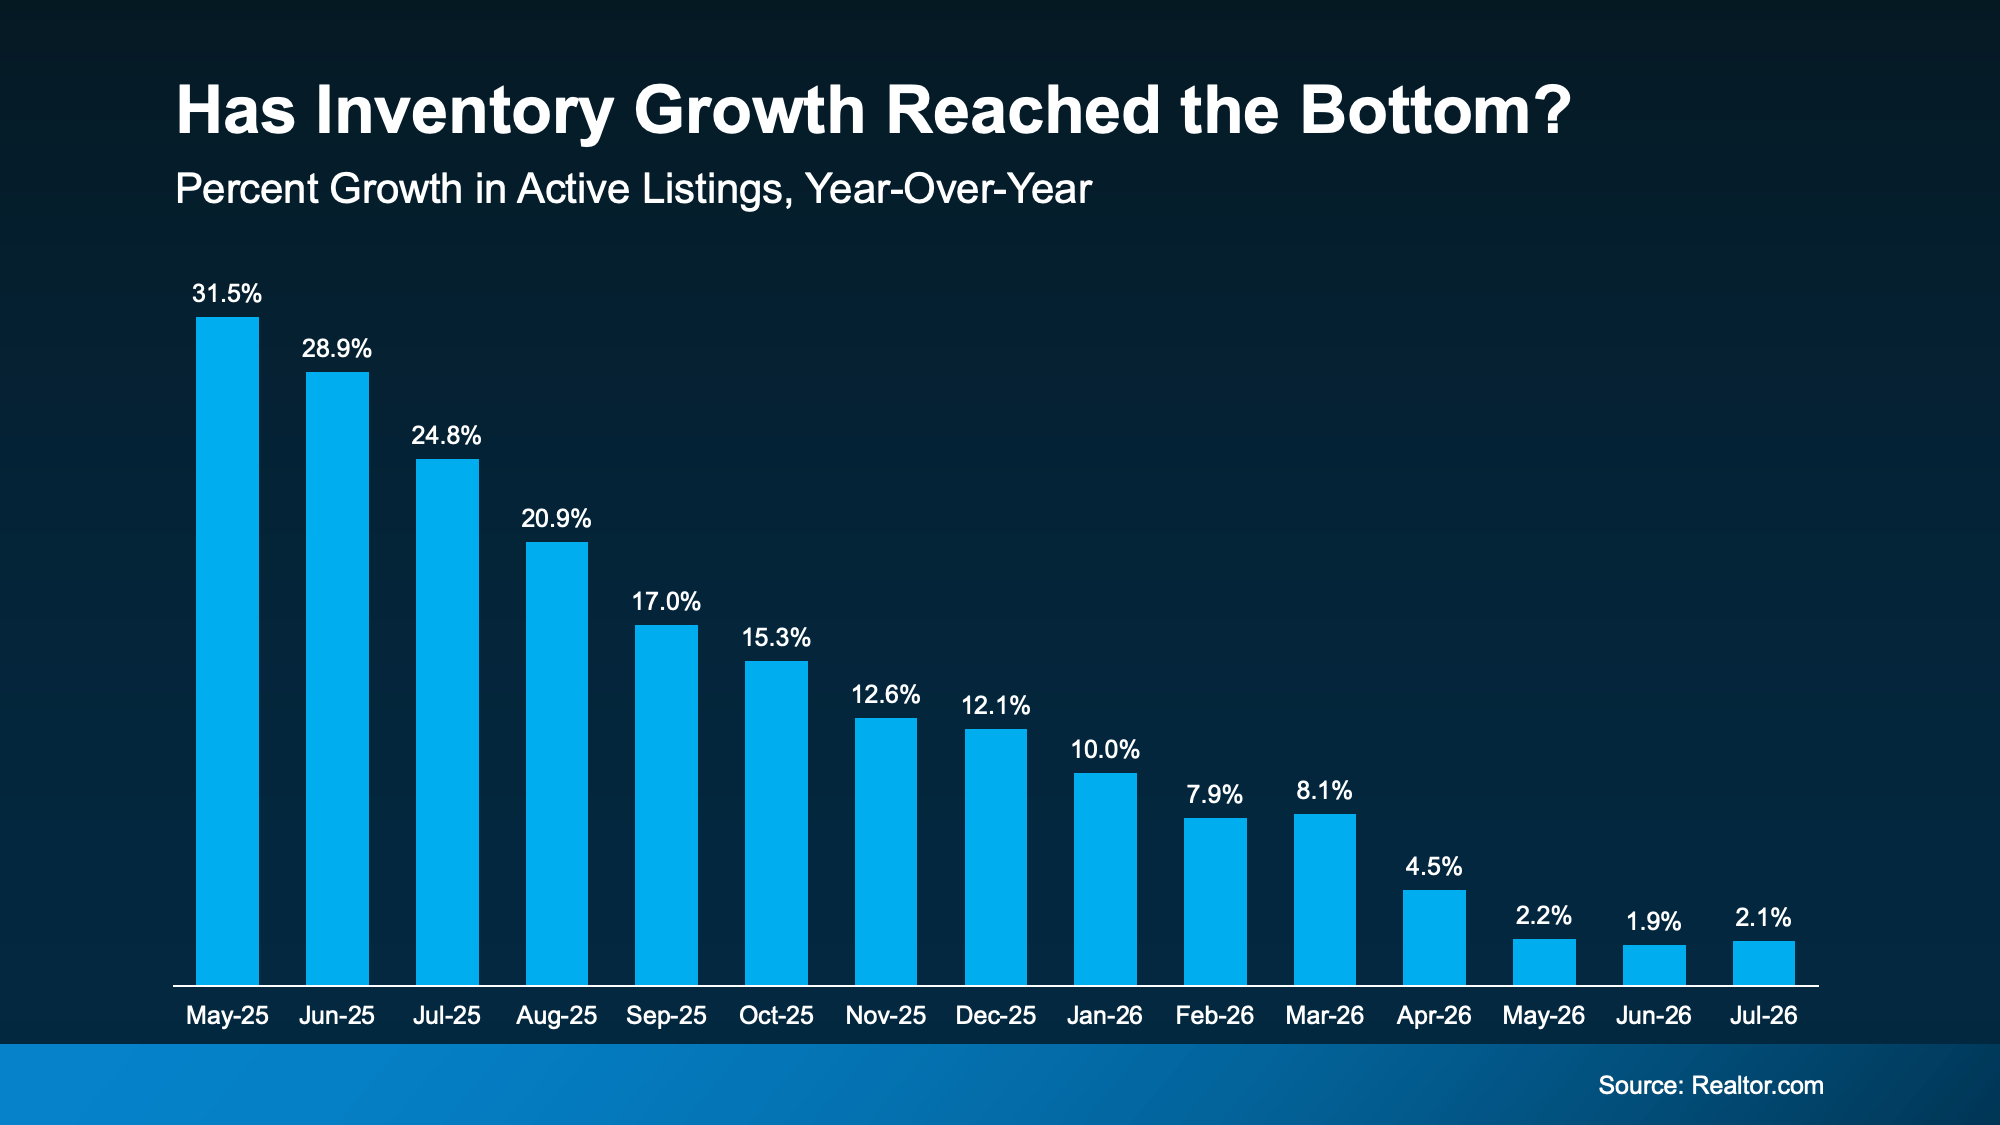
Active listings were up 2.1% year-over-year in July, according to Realtor.com. Back in January, inventory was up 10%. And in May of 2025, it was up 31.5%. So, growth has cooled off a lot over the last year.

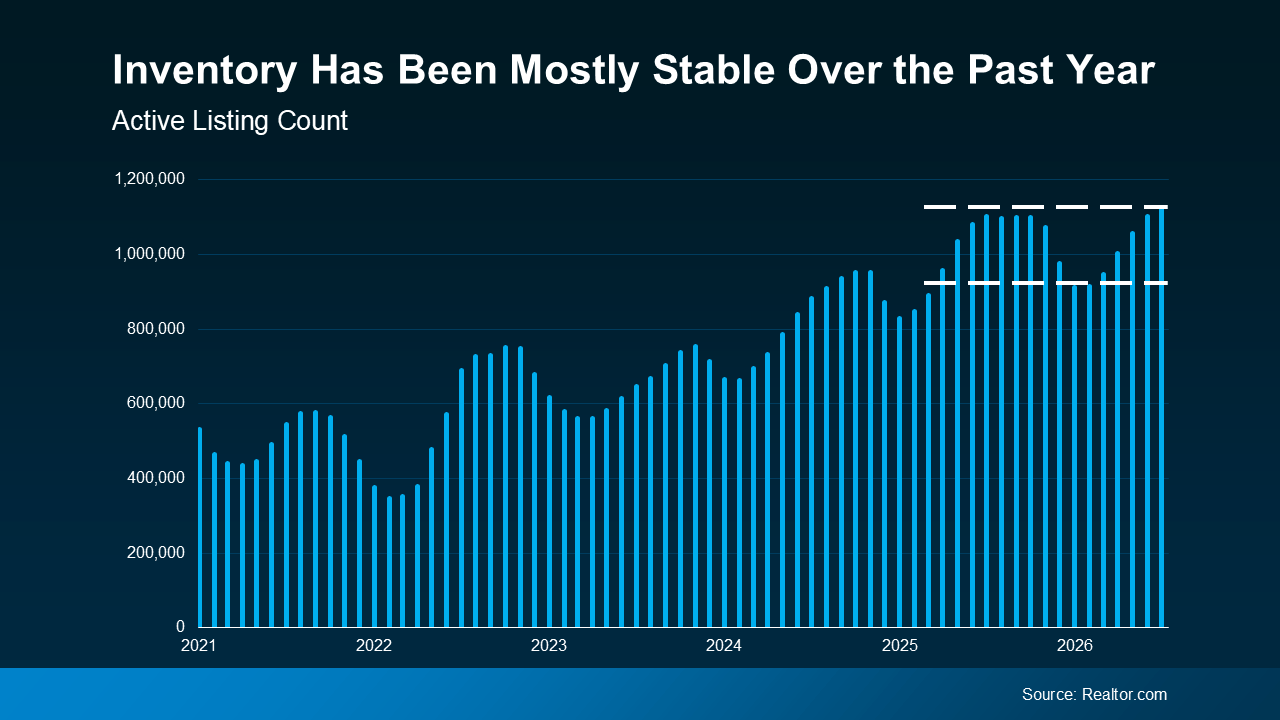
The past 3 months, though, have all seen inventory growth land in roughly the same range, which is a sign this slowdown may be nearing its floor (see graph below):

a graph of growth in a blue background

So, what does that mean for you?

Homes are still coming onto the market. Every single one of these bars shows a period where inventory grew. So, don’t be discouraged or let this make you think you’re out of options. Plus, we’ve seen more stability in the numbers lately, which is a good sign.

The Most Homes for Sale Since 2019

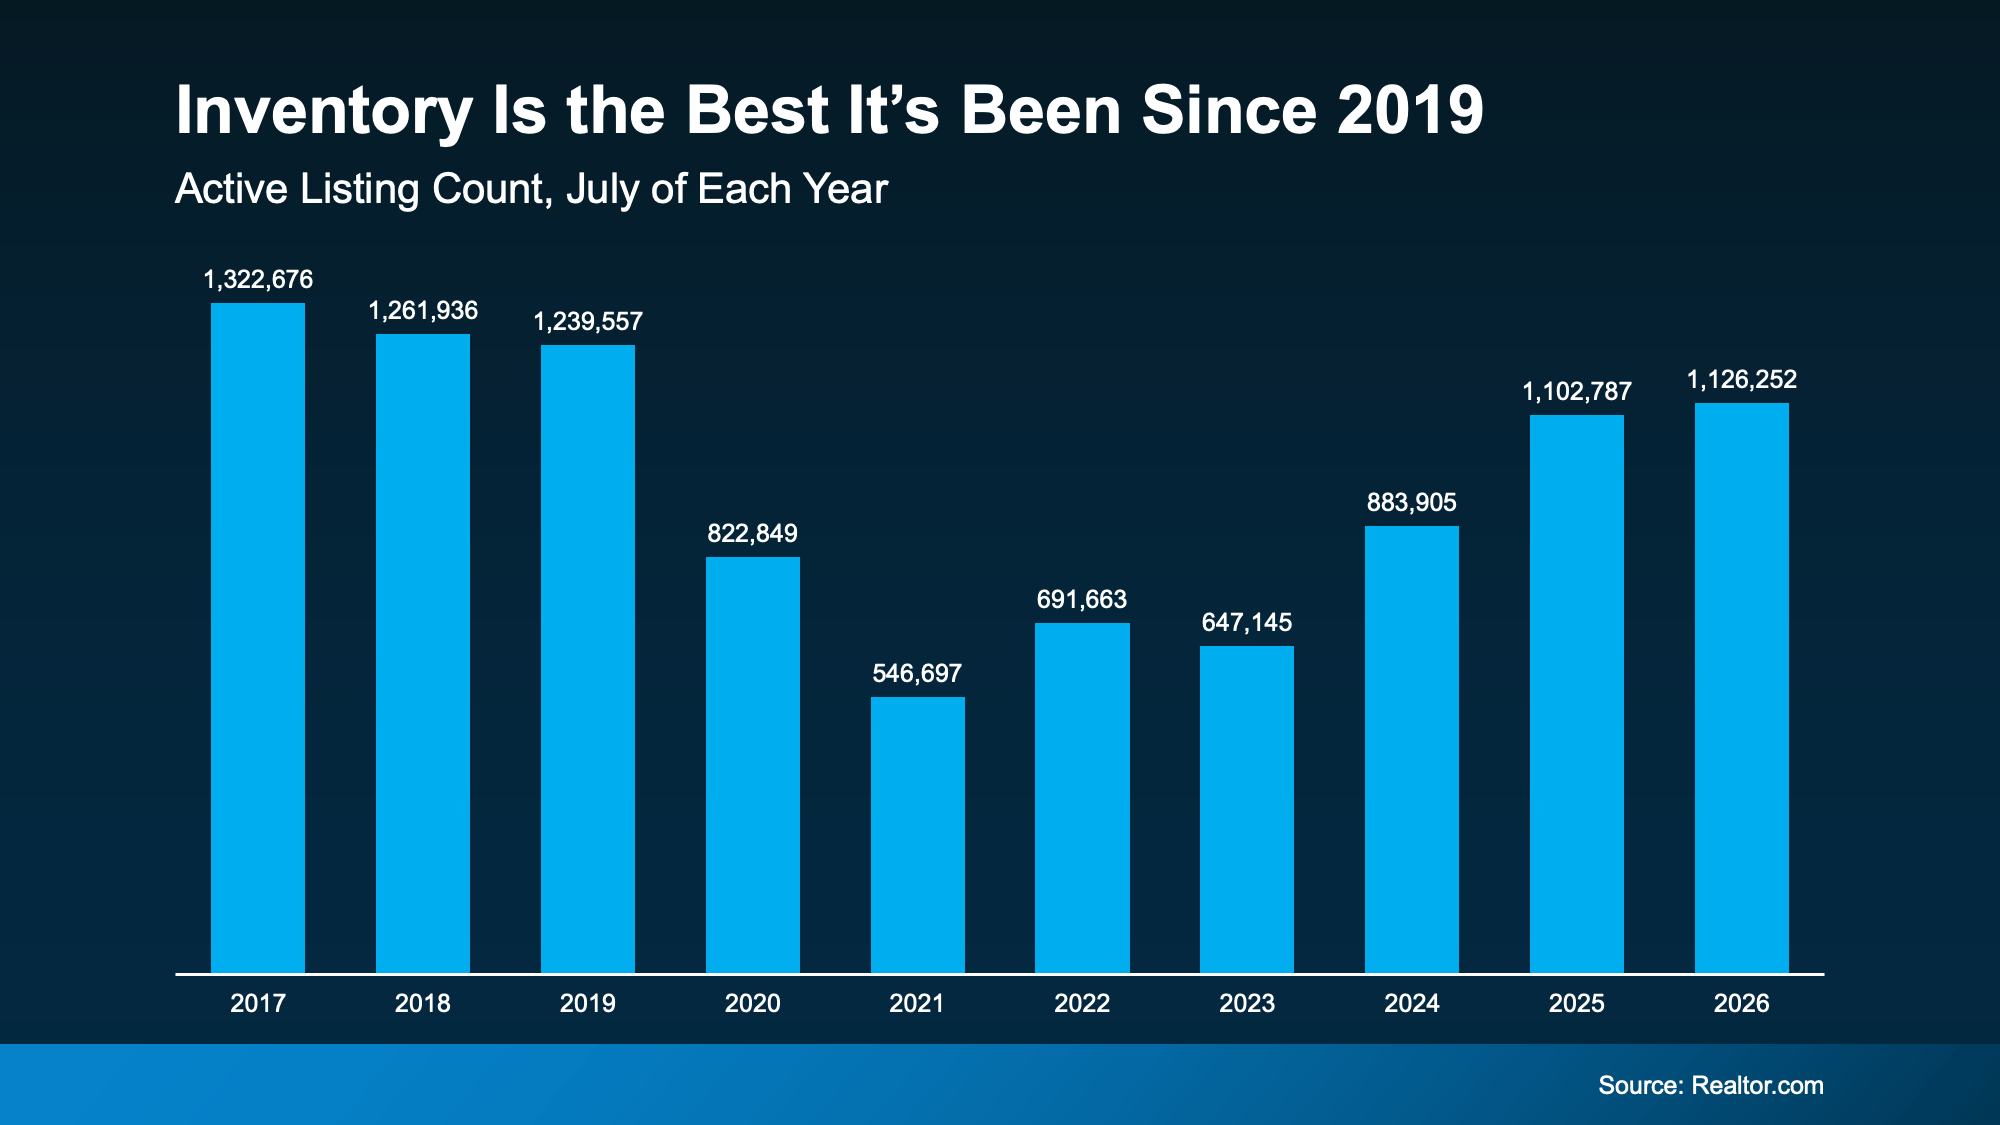
Compared to the rock-bottom lows of 2021, inventory has climbed back substantially. Nationally, the number of homes for sale has been up year-over-year consistently now for 33 months. And inventory has almost doubled in just a few years. So don’t get too hung up on the pace of that increase.

This July was actually the best July for inventory since 2019 (see graph below):

a graph of blue bars with white text

Now, the market still needs about 150k listings to get back to pre-pandemic levels, but things are quickly approaching normal. And experts think we may even be back to 2019 levels by the end of this year, even with the slowdown we’ve already seen.

And that’s thanks to one unlikely factor: mortgage rates

Why Higher Rates May Actually Help Inventory Grow

It works like this. When mortgage rates climb, inventory tends to climb with them. As Mike Simonsen, Chief Economist at Compass, explains:

When rates rise; inventory rises. When rates fall; inventory falls. So, from July last year to March this year, rates ease lower and all the inventory growth of the past several years evaporated. If rates move higher from here or stay elevated for [a] longer period of time, then we should expect supply to build again.

Well, rates are expected to hold in the mid-to-upper 6% range for a while longer, and Realtor.com‘s latest forecast has inventory ending 2026 up 3.6% year-over-year.

That means 2 things:

  • Inventory growth is forecast to pick up a little bit throughout the rest of the year.

  • And, inventory is projected to close the year at a historically normal level, right about where it stood at the end of 2019.

For buyers, that’s a win. Even if today’s rates aren’t your favorite, they’re helping the number of homes on the market to grow. And more homes for sale means more choices, more room to negotiate, and less pressure to rush your search.

Bottom Line

The number of homes for sale is growing slowly but surely, and that means more options for your move. Want to see what’s available in your area? Reach out to a local real estate agent.

The Kind of House Buyers Are Willing To Pay More For

The Kind of House Buyers Are Willing To Pay More For

The Kind of House Buyers Are Willing To Pay More For Simplifying The Market

That spare room on the main floor. The finished basement with a kitchenette and its own entrance. The bonus room you’ve been using for storage.

To you, it’s extra space. But to a growing pool of buyers, it’s the reason they’d pick your house. Here’s why. Multi-generational homebuying is on the rise.

Millions of Families Are Living Multi-Generationally

The number of multi-generational households is climbing. That’s when 3 or more generations live under one roof. And data shows those households grew from 3.2 million to almost 4 million between 2014 and 2024, according to Realtor.com.

And each year, more people are shopping for a larger home that fits their combined needs.

While the appetite for this type of house is rising across the board, data from USAFacts shows multi-generational living is more common in some states than others. The darker the state in the map below, the more common it is in that area (see map below):

a map of the united states

Where does your state fall? Depending on where you are, the pool of buyers looking for a house like yours could be even bigger than you’d think. But the overall bottom line is this.

There’s a real market out there for larger homes with room for multiple generations under one roof, especially since affordability is still so tight. And if you own a house like that, it’s in demand.

Multi-Generational Houses Sell at a Premium

And that extra room carries real value with the right buyer. According to Realtor.com, in 2025 the median asking price for a multi-generational house was $709,000 – roughly 65% higher than the $429,900 median for a standard house.

Some of that is simply size. But compare multi-generational homes to regular homes with the same amount of square footage, and they still come out on top – $262 per square foot versus $215.

That’s a 22% premium you could command for special features like in-law suites, second kitchens, and separate entries (see graph below):

a graph of a home sales

When you sell, this could help you walk away with more money in your pocket, especially when your agent highlights your home’s multi-generational-friendly features in your listing.

And Buyers Aren’t Getting Sticker Shock

And even with slightly higher price tags, buyers aren’t flinching. Multi-generational houses drew 13.5% more online views than standard ones, and they still sold just as fast – in about 59 days – per the same Realtor.com report.

Hannah Jones, Senior Economic Research Analyst at Realtor.com, explains:

“The strong demand and steep premiums we are seeing in inventory-constrained markets point to a real mismatch between what buyers are looking for and what is actually available. For sellers in these markets, this type of home can be a significant asset.”

Basically, when buyers want something that’s very specific, the house that checks the box tends to stand out.

Bottom Line

Your multi-generational-friendly, or simply larger-than-average, house might meet criteria a lot of buyers can’t find in a standard one. That’s what gets attention. And offers. So, talk to a local real estate agent about what it could get you in your market right now.

Who Has the Upper Hand in Today’s Housing Market?

Who Has the Upper Hand in Today’s Housing Market?

Who Has the Upper Hand in Today's Housing Market? Simplifying The Market

Ask around and almost every homebuyer out there wants to know if there’s a way to get a better deal. And just about every seller wants to know if they’ll still get top dollar.

The interesting thing is… both can be right at the exact same time. It just depends on where you live.

That’s because today’s housing market isn’t moving in one direction anymore. Some markets clearly favor buyers. Others still favor sellers. But most are sitting somewhere in the middle.

And knowing which market you’re actually in can completely change the strategy you use to buy or sell (and what expectations you should have). Let’s break it down.

One Number Tells You Who’s Got Leverage

So how do you know which market you’re in? There’s one number that tells the story faster than anything else: the months’ supply of homes for sale. It’s the clearest signal of who’s got leverage – and what strategy you’ll need. Think of it like this.

Imagine no additional homes were listed starting today. Months’ supply tells us how long it would take to sell everything that’s currently on the market based on today’s demand. 

Generally speaking, if months’ supply is:

  • Fewer than 4 months: Sellers usually have the advantage.

  • 4 to 6 months: Buyers and sellers are on more equal footing.

  • More than 6 months: Buyers can usually negotiate for a better deal.

Right now, the National Association of Realtors (NAR) data says that number is 4.6 and that puts the overall market back in balanced territory (see graph below):

a graph of a market

That means, as a whole, the market has finally moved back into a much more balanced range after years of being tilted in sellers’ favor. While that may look like the scales have tipped only slightly, it’s enough to make a real difference in what strategy you’ll need for your move – at least in most places.

The Tale of Two Markets: Why ‘Balanced’ Doesn’t Mean the Same Thing Everywhere

Redfin data helps shed some light on how this shakes out across the country. It breaks down which cities are leaning in either direction (see graph below).

  • Some markets give buyers more leverage. Those are in blue.

  • Some still favor sellers. That’s the orange.

  • Others fall somewhere in between. Those are gray. 

a graph of a marketNotice anything? A lot more places are seeing more buyer-friendly conditions right now.  In fact, this is the most buyer-friendly market we’ve seen in nearly 6 years.

But don’t take that as buyers have the upper hand everywhere.

There are still cities where sellers still have the power. And if you’re in one of them, your approach to selling or buying looks completely different than it would in a buyer-leaning market.

The Biggest Mistake You Can Make Right Now

That’s why the biggest mistake isn’t thinking it’s finally a buyer’s market. And it isn’t thinking it’s still a seller’s market either. It’s making any assumption without talking to an expert agent first.

Today’s market is incredibly local. In one market, a buyer may be getting thousands of dollars in concessions from a seller. And a homeowner may have to consider dropping their price.  

But in another, a buyer may be stressed about coming in with their best offer, or they may lose out on the home to another buyer. And a seller may still be seeing strong demand and prices inching higher.

Same overall housing market.

Very different experiences.

The truth is what’s happening in your back yard affects everything from pricing your house to making an offer to negotiating repairs or concessions. And that’s why an agent’s local knowledge matters more now than ever before.

Your plan has to be based on your neighborhood – and only an agent has the expertise to get that right.

Bottom Line

This market isn’t one-size-fits-all.

If you’re wondering who has the upper hand where you live, talk to a local agent. They’ll help you understand what’s happening in your market, who’s got the leverage, and what strategy gives you the best shot at getting what you want.

Here’s Why Mortgage Rates Are What They Are Right Now

Here’s Why Mortgage Rates Are What They Are Right Now

Here’s Why Mortgage Rates Are What They Are Right Now Simplifying The Market

If you’re waiting for mortgage rates to fall a lot before you buy, you may be waiting a while. But before you get discouraged, there’s a number working behind the scenes that’s actually good for you right now. It’s called the spread, and once you understand it, you may see today’s rates in a whole new light.

The Pattern That’s Held for 50+ Years

For starters, mortgage rates don’t move on their own. They tend to follow the 10-year treasury yield, a number tied to how investors feel about the economy.

It’s not an exact science, since plenty of other factors can move it day to day, but broadly speaking, when the economy looks strong, that yield tends to climb over time. When the outlook gets shaky, it tends to ease. For over 50 years, the 10-year treasury yield and mortgage rates have moved almost in lockstep (see graph below):

a graph of a graph showing the number of mortgage rates

The gap between them is called the “spread.” On average, that gap runs about 1.76 percentage points. And that spread impacts your mortgage rate. A wider spread tends to push mortgage rates higher than the treasury yield alone would suggest, while a narrower spread keeps rates closer to the treasury yield.

One of the Big Reasons Rates Likely Won’t Drop Dramatically Anytime Soon

If you’re hoping mortgage rates will drop a lot, here’s the reality – they probably won’t, at least not anytime soon. One of the big reasons why comes down to that spread between the 10-year treasury yield and mortgage rates.

A few years ago, that gap got a lot wider as uncertainty in the economy pushed it as high as 3.19 points in 2023.

Now here’s the part worth noting – that gap has been narrowing lately. It’s down to about 2.01, just above the long-term average of 1.76 (see graph below):

a graph of a graph of a graph of a graph of a graph of a graph of a graph of a graph of a graph of a graph of a graph of a graph of a graph of

When the gap is wide, there’s more room for rates to fall. But when it’s relatively normal, like it is now, there’s less wiggle room for rates to fall.

Why Mortgage Rates Aren’t Higher Right Now

Today’s mortgage rate is basically the treasury yield plus the spread. So, when either one moves, your rate moves with it. Here are 3 different rates, all built off today’s 10-year treasury yield of 4.68% to show you just how much the spread matters for your bottom line (see graph below):

a graph of a graph showing a rate of interest

If the spread were still stretched out like it was in 2023, rates would be pushing close to 8% right now. That’s because the spread was over a full point wider than it is today.

But now, thanks to the spread narrowing recently, today’s rate sits around 6.69%. That’s the middle scenario in that visual. That’s a big difference in your monthly payment compared what we could see if the spread was as big as it was 2023. As Logan Mohtashami, Lead Analyst at HousingWire, put it:

“Of course, mortgage spreads being better in 2026 is the housing hero story of the year . . .”

Now compare that middle bar to the 3rd one. If the spread were sitting at its exact long-term average, rates would be around 6.5%. That’s only about a quarter of a point away from where rates actually are today. That means most of the improvement in mortgage rates we should realistically expect from a shrinking spread has already happened.

In other words, the same narrowing spread that’s the reason rates aren’t close to 8% today is also a big reason why they’re not likely to fall a lot further.

Bottom Line

That’s the trade-off with a narrowing spread. Rates may not be where you want them, but they’re better than they could’ve been. If you want help figuring out what that means for your monthly payment, reach out to a local lender

Home Price Growth Slowed Down. That May Be Changing.

Home Price Growth Slowed Down. That May Be Changing.

Home Price Growth Slowed Down. That May Be Changing. Simplifying The Market

After more than a year of headlines talking about how home prices are going to crash, the latest data shows that price growth may be starting to pick back up again. And depending on whether you’re buying or selling, that shift means something different for you.

The Numbers May Be Starting To Turn

For the past couple of years, home price growth has been moderating – cooling from around 7% in mid-2024, according to Redfin (see graph below). But look at the right side of that graph. The pace of that growth appears to have hit its low point and started to turn.

a graph of growth in a number of years

While a couple months of data doesn’t necessarily mean this will be a lasting trend, there are some other signs that this could continue.

For example, fewer markets are seeing prices decline. According to ResiClub and Zillow, about 36% of the 300 largest housing markets had falling prices as of the middle of last year. Since the start of this year, that share has been shrinking. Now? Only 23% are experiencing those mild dips (see graph below):

a graph of the price of a house

When fewer markets see prices falling, that means more markets are seeing prices rise again.

And forecasts suggest this shift has room to run. On average, experts project home prices will rise about 2.3% nationally this year. And for that to happen, price growth would have to pick up a bit in the second half of 2026.

But Remember, Real Estate Is Local

While it looks like national prices may be starting to pick back up a tiny bit, that doesn’t mean that’s what’s happening in your neighborhood.

National home prices are really just an average of hundreds of local markets. Some are climbing faster. Others are still cooling. But one reason the national average may be looking up is because a growing number of metros may actually be net positive for prices this year.

Not long ago, the major metros were split about 50/50 – half seeing prices rise and half seeing them fall. Now, that balance looks like it’s starting to tip in a more positive direction. Just last month, more than half of the major metros saw prices go up, according to Redfin (see graph below):

a graph of prices on a dark background

As Selma Hepp, Chief Economist at Cotality, explains:
“. . . local markets continue to tell very different stories. Annual home price growth has changed little since the start of the year, but some markets, especially those supported by strong job and income growth in the West and more affordable Midwest markets, have seen notable acceleration in price gains.”

What This Means for You

Home price headlines can be confusing because they don’t always tell the full picture. Lean on an agent to understand what’s happening in your local market and what the early signs say for where prices may go from here.

That’s the best way to stay one step ahead of the market.

If you’re buying: slower price growth has worked in your favor. You’ve had more room to negotiate and a budget you could plan around. If price growth is picking up in your area, buying now may mean paying less than you would later this year.

If you own a home: you’ve been gaining equity all along, even while growth moderated. If growth keeps picking up, those gains could speed up, too. Lawrence Yun, Chief Economist at the National Association of Realtors (NAR), projects the typical homeowner will gain roughly $16,000 in housing wealth this year. And if you’re thinking about selling, this shift is a good early sign for you. Just remember, the market is still pretty balanced and buyer-friendly in a lot of areas right now.

Home price growth slowed way down, and now it’s showing early signs of picking back up. Whether you’re buying or selling, let’s connect so you can see exactly what prices are doing in our local market and what that means for your plans.

Bottom Line

Home price growth slowed way down, and now it’s showing early signs of picking back up. Whether you’re buying or selling, connect with a local real estate agent so you can see exactly what prices are doing in your local market and what that means for your plans.

Selling a Luxury House? Here’s Why Now Is a Good Time

Selling a Luxury House? Here’s Why Now Is a Good Time

Selling a Luxury House? Here’s Why Now Is a Good Time Simplifying The Market

If you own a luxury house, you’re in a stronger spot than most sellers right now. While much of the market has cooled, the high-end tier hasn’t. Sale prices and buyer demand are both up. So if you’re considering selling, now could be a great time to make your move.

Luxury Is Leading on Price

Let’s start with prices. But before we get into it – what actually counts as a luxury home? Generally, these are homes in the top 5% price range for the area, so it varies depending on where you live.

But what’s interesting is that according to the latest data from Redfin, sale prices for luxury houses have risen about three times faster than for non-luxury.

Right now, the typical home’s sale price is up about 1.5% year-over-year. But high-end homes? Their sale prices have gone up nearly 5% since last year (see graph below):

a graph of sales

That’s a bigger deal than it sounds like.

Despite all the talk about slowing price growth lately, sale prices in this segment of the market may be rising faster than you’d expect based on the headlines. That’s going to be a good thing if you’re thinking about selling. And rising sale prices are only half the story.

Buyers Are Showing Up, Too

While so many headlines are talking about how buyers are pulling back, that’s not necessarily true when it comes to luxury homes. In fact, right now, it looks like the higher the price point, the more active the buyers.

Lawrence Yun, Chief Economist with the National Association of Realtors (NAR), explains:

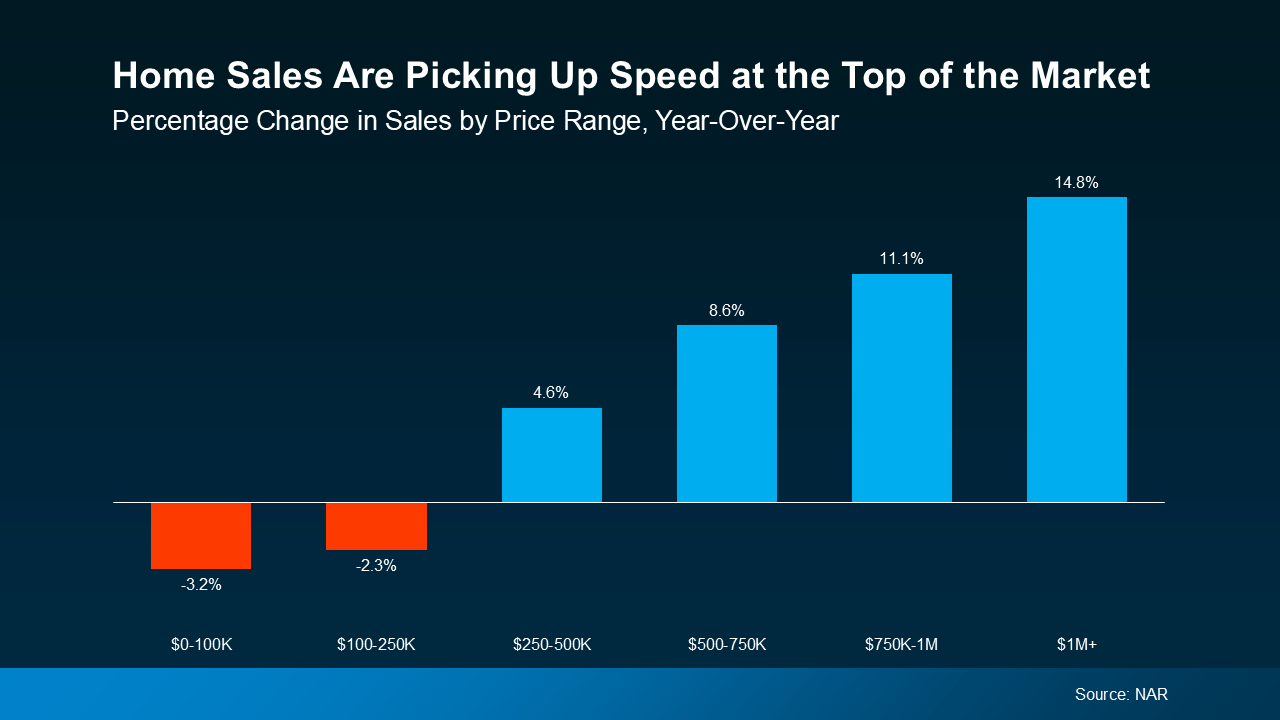
The luxury market has really performed better compared to the lower price point. . . . if we look at price points, any home priced under $250,000, virtually no change in unit sales from one year ago. Then you go into the upper price category, and home sales are up about 10% from one year ago. But the million dollar-plus homes, it is up by 18% from one year ago.

Basically, more homes are selling on the upper end of the market. A big reason is that high-end buyers tend to feel less of the affordability pressure weighing on many households today, so they keep buying even when the wider market slows.

That demand also means that luxury houses don’t stay on the market as long as they used to.

Luxury Houses Are Selling Relatively Quickly

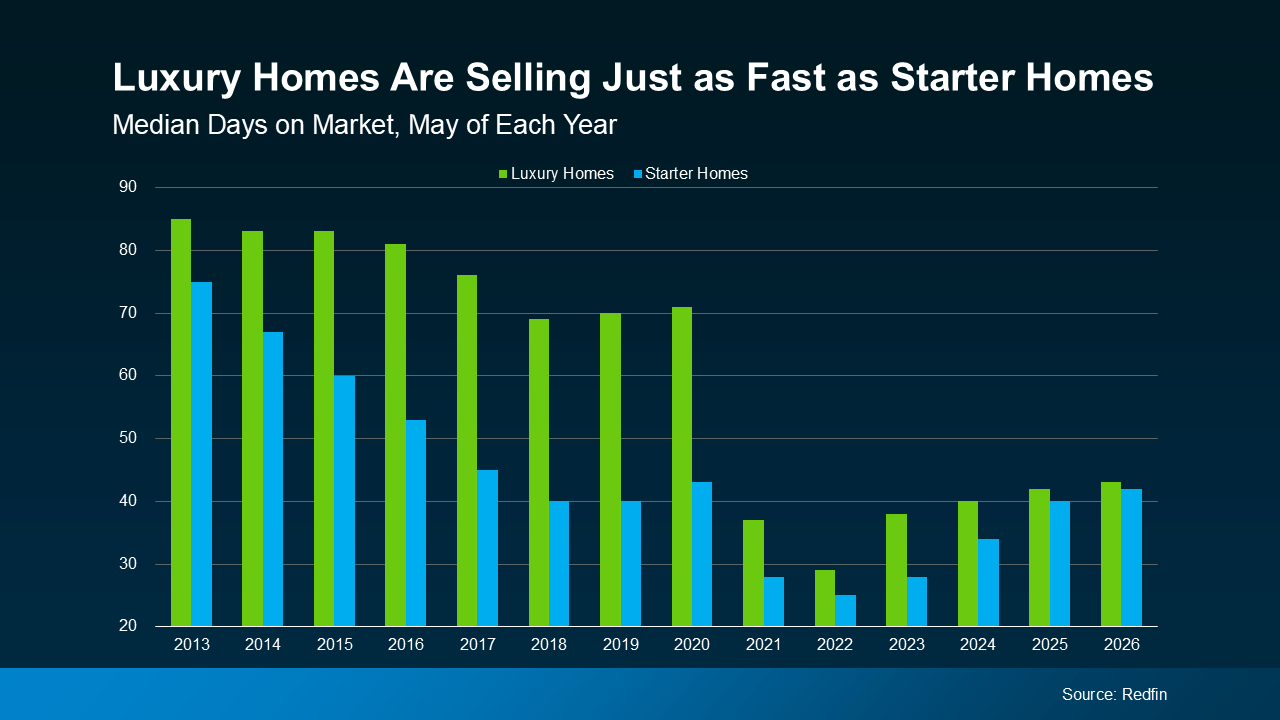
According to the most recent data from Redfin, for luxury homes the median number of days on market is under 50. That’s much faster than pre-pandemic norms going even as far back as 2014 (see graph below):

a graph of sales in a market

That means you probably won’t spend a ton of time sitting in limbo wondering when you’ll get an offer.

Bottom Line

Selling a high-end house is a big decision, and you deserve to feel confident going in. With sale prices climbing and buyers active at the top, this is a strong window to make your move.

When you’re ready to cash in, connect with a local real estate agent to talk strategy.

Pin It on Pinterest