Oops! Home Prices Didn’t Crash After All

Oops! Home Prices Didn’t Crash After All

Oops! Home Prices Didn’t Crash After All Simplifying The Market

During the fourth quarter of last year, many housing experts predicted home prices were going to crash this year. Here are a few of those forecasts:

Jeremy Siegel, Russell E. Palmer Professor Emeritus of Finance at the Wharton School of Business:

“I expect housing prices fall 10% to 15%, and the housing prices are accelerating on the downside.”

Mark Zandi, Chief Economist at Moody’s Analytics:

“Buckle in. Assuming rates remain near their current 6.5% and the economy skirts recession, then national house prices will fall almost 10% peak-to-trough. Most of those declines will happen sooner rather than later. And house prices will fall 20% if there is a typical recession.” 

Goldman Sachs

“Housing is already cooling in the U.S., according to July data that was reported last week. As interest rates climb steadily higher, Goldman Sachs Research’s G-10 home price model suggests home prices will decline by around 5% to 10% from the peak in the U.S. . . . Economists at Goldman Sachs Research say there are risks that housing markets could decline more than their model suggests.”

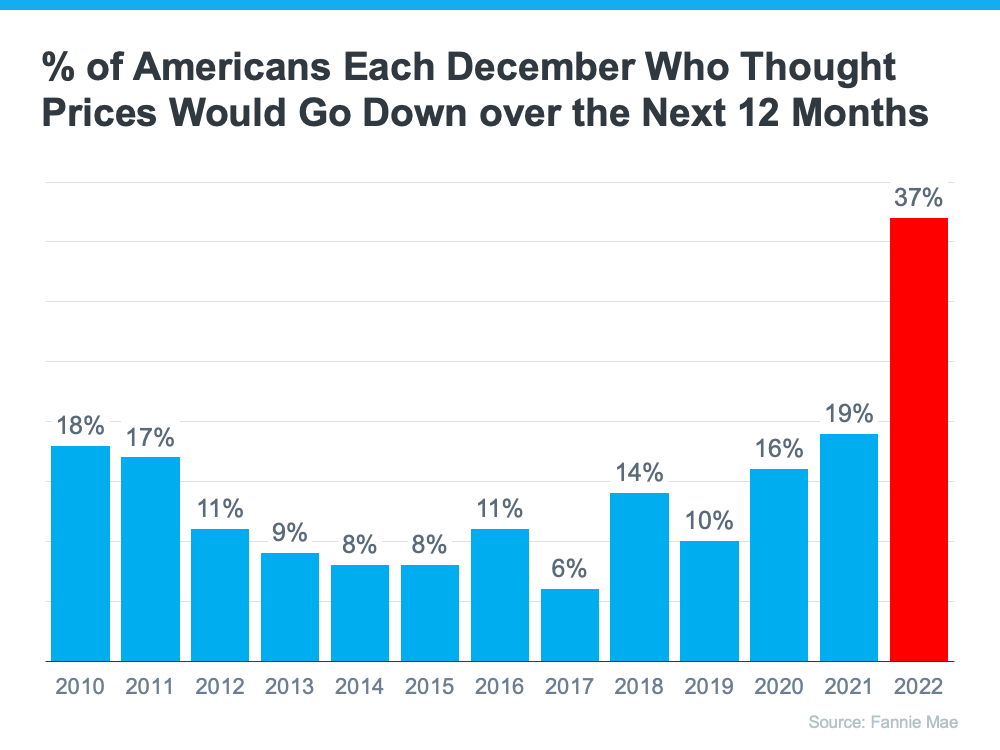
The Bad News: It Rattled Consumer Confidence

These forecasts put doubt in the minds of many consumers about the strength of the residential real estate market. Evidence of this can be seen in the December Consumer Confidence Survey from Fannie Mae. It showed a larger percentage of Americans believed home prices would fall over the next 12 months than in any other December in the history of the survey (see graph below). That caused people to hesitate about their homebuying or selling plans as we entered the new year.

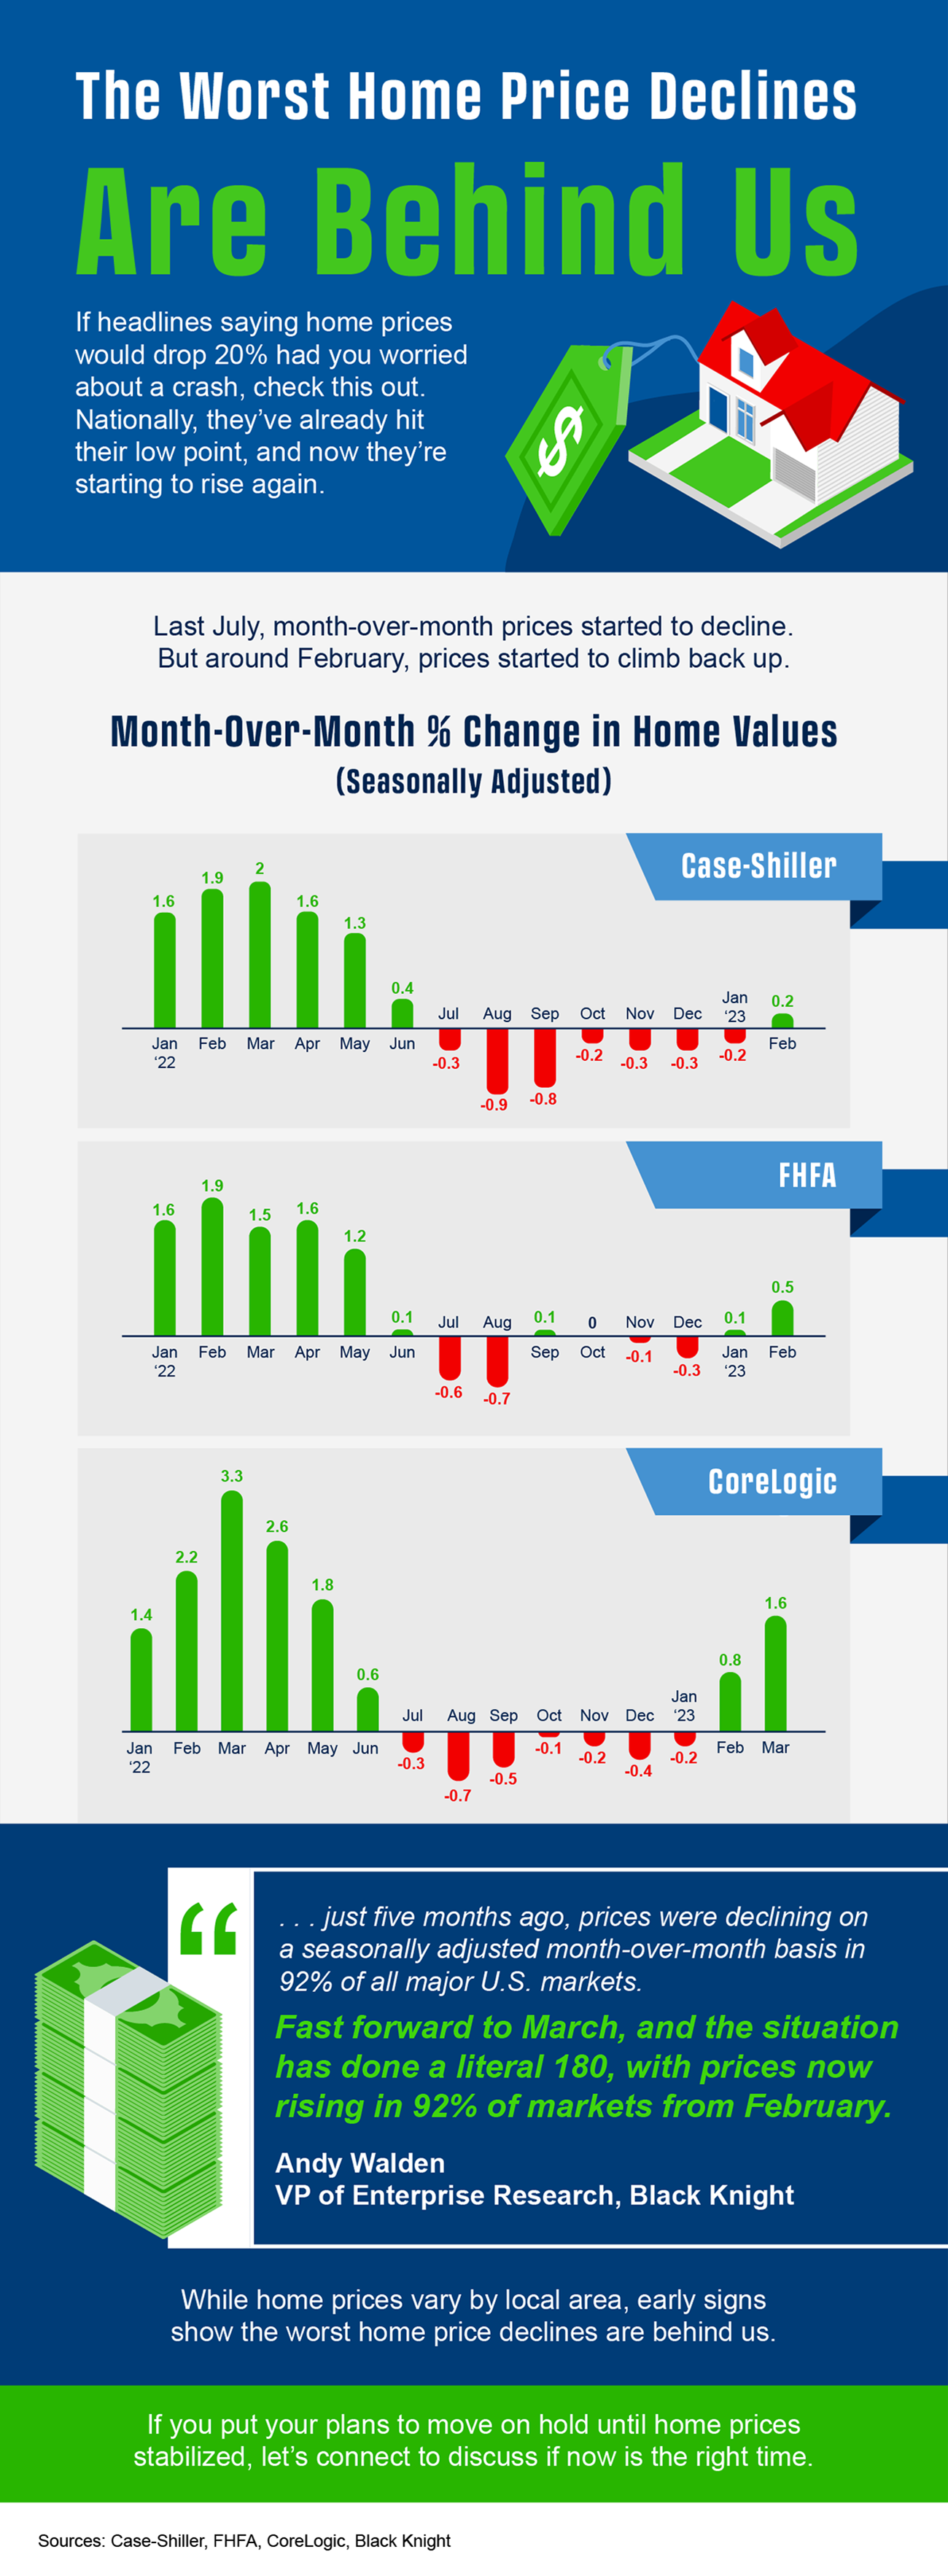
The Good News: Home Prices Never Crashed

However, home prices didn’t come crashing down and seem to be already rebounding from the minimal depreciation experienced over the last several months. 

In a report just released, Goldman Sachs explained:

“The global housing market seems to be stabilizing faster than expected despite months of rising mortgage rates, according to Goldman Sachs Research. House prices are defying expectations and are rising in major economies such as the U.S.,. . . ”

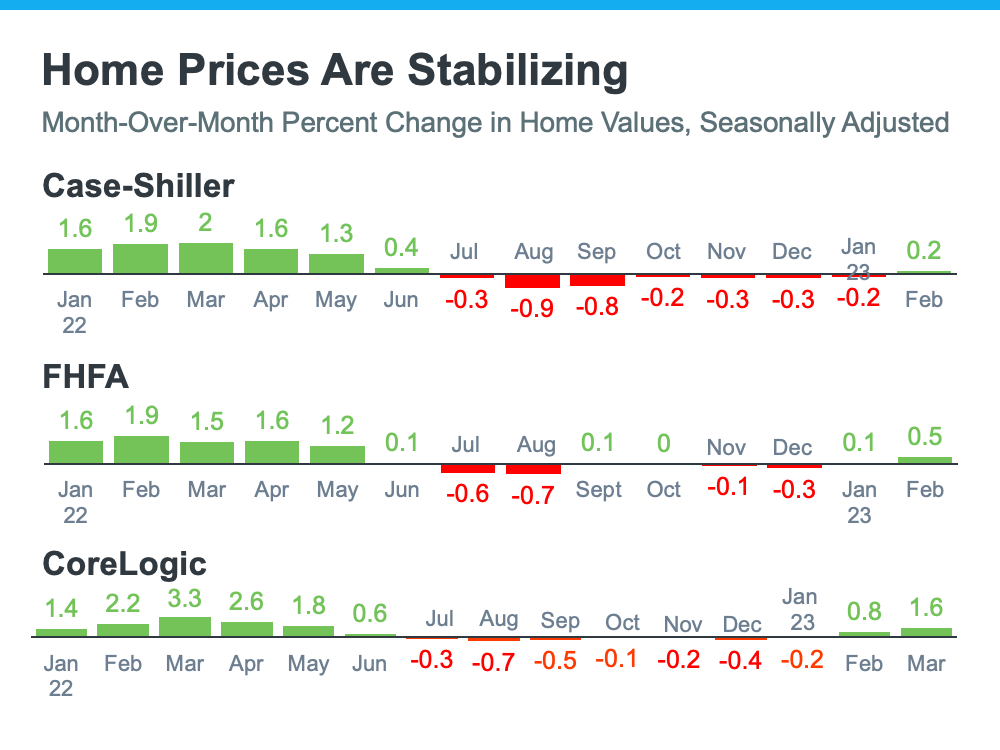
Those claims from Goldman Sachs were verified by the release last week of two indexes on home prices: Case-Shiller and the FHFA. Here are the numbers each reported:

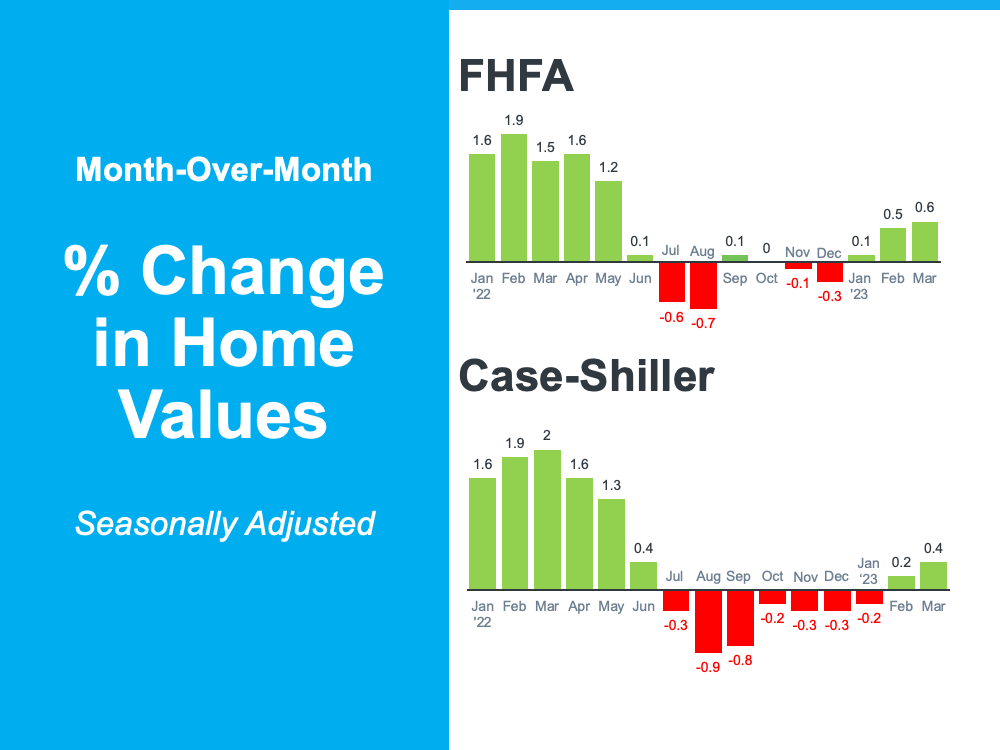
Home values seem to have turned the corner and are headed back up.

Bottom Line

The housing market is much stronger than many think. To get a true evaluation of your local market, reach out to a trusted real estate professional.

Today’s Real Estate Market: The ‘Unicorns’ Have Galloped Off

Today’s Real Estate Market: The ‘Unicorns’ Have Galloped Off

Today’s Real Estate Market: The ‘Unicorns’ Have Galloped Off Simplifying The Market

Comparing real estate metrics from one year to another can be challenging in a normal housing market. That’s due to possible variability in the market making the comparison less meaningful or accurate. Unpredictable events can have a significant impact on the circumstances and outcomes being compared. 

Comparing this year’s numbers to the two ‘unicorn’ years we just experienced is almost worthless. By ‘unicorn,’ this is the less common definition of the word:

“Something that is greatly desired but difficult or impossible to find.” 

The pandemic profoundly changed real estate over the last few years. The demand for a home of our own skyrocketed, and people needed a home office and big backyard. 

  • Waves of first-time and second-home buyers entered the market.
  • Already low mortgage rates were driven to historic lows. 
  • The forbearance plan all but eliminated foreclosures.
  • Home values reached appreciation levels never seen before.

It was a market that forever had been “greatly desired but difficult or impossible to find.” A ‘unicorn’ year.

Now, things are getting back to normal. The ‘unicorns’ have galloped off. 

Comparing today’s market to those years makes no sense. Here are three examples: 

Buyer Demand 

If you look at the headlines, you’d think there aren’t any buyers out there. We still sell over 10,000 houses a day in the United States. Of course, buyer demand is down from the two ‘unicorn’ years. But, according to ShowingTime, if we compare it to normal years (2017-2019), we can see that buyer activity is still strong (see graph below):

Home Prices

We can’t compare today’s home price increases to the last couple of years. According to Freddie Mac, 2020 and 2021 each had historic appreciation numbers. Here’s a graph also showing the more normal years (2017-2019):

We can see that we’re returning to more normal home value increases. There were several months of minimal depreciation in the second half of 2022. However, according to Fannie Mae, the market has returned to more normal appreciation in the first quarter of this year.

Foreclosures 

There have already been some startling headlines about the percentage increases in foreclosure filings. Of course, the percentages will be up. They are increases over historically low foreclosure rates. Here’s a graph with information from ATTOM, a property data provider:

There will be an increase over the numbers of the last three years now that the moratorium on foreclosures has ended. There are homeowners who lose their home to foreclosure every year, and it’s heartbreaking for those families. But, if we put the current numbers into perspective, we’ll realize that we’re actually going back to the normal filings from 2017-2019.

SBottom Line

There will be very unsettling headlines around the housing market this year. Most will come from inappropriate comparisons to the ‘unicorn’ years. A real estate professional is a great resource to help you keep everything in proper perspective.

What You Need To Know About Home Price News

What You Need To Know About Home Price News

What You Need To Know About Home Price News Simplifying The Market

The National Association of Realtors (NAR) will release its latest Existing Home Sales Report tomorrow. The information it contains on home prices may cause some confusion and could even generate some troubling headlines. This all stems from the fact that NAR will report the median sales price, while other home price indices report repeat sales prices. The vast majority of the repeat sales indices show prices are starting to appreciate again. But the median price reported on Thursday may tell a different story. 

Here’s why using the median home price as a gauge of what’s happening with home values isn’t ideal right now. According to the Center for Real Studies at Wichita State University:

“The median sale price measures the ‘middle’ price of homes that sold, meaning that half of the homes sold for a higher price and half sold for less. While this is a good measure of the typical sale price, it is not very useful for measuring home price appreciation because it is affected by the ‘composition’ of homes that have sold.

For example, if more lower-priced homes have sold recently, the median sale price would decline (because the “middle” home is now a lower-priced home), even if the value of each individual home is rising.”

People buy homes based on their monthly mortgage payment, not the price of the house. When mortgage rates go up, they have to buy a less expensive home to keep the monthly expense affordable. More ‘less-expensive’ houses are selling right now, and that’s causing the median price to decline. But that doesn’t mean any single house lost value. 

Even NAR, an organization that reports on median prices, acknowledges there are limitations to what this type of data can show you. NAR explains:

“Changes in the composition of sales can distort median price data.”

For clarification, here’s a simple explanation of median value:

  • You have three coins in your pocket. Line them up in ascending value (lowest to highest).
  • If you have one nickel and two dimes, the median value of the coins (the middle one) in your pocket is ten cents.
  • If you have two nickels and one dime, the median value of the coins in your pocket is now five cents.
  • In both cases, a nickel is still worth five cents and a dime is still worth ten cents. The value of each coin didn’t change.

The same thing applies to today’s real estate market.

SBottom Line

Actual home values are going up in most markets. The median value reported tomorrow might tell a different story. For a more in-depth understanding of home price movements, reach out to a local real estate professional.

The Worst Home Price Declines Are Behind Us

The Worst Home Price Declines Are Behind Us

The Worst Home Price Declines Are Behind Us Simplifying The Market

If you’re following the news today, you may feel a bit unsure about what’s happening with home prices and fear whether or not the worst is yet to come. That’s because today’s headlines are painting an unnecessarily negative picture. Contrary to those headlines, home prices aren’t in a freefall. The latest data tells a very different and much more positive story. Local home price trends still vary by market, but here’s what the national data tells us.

If we take a year-over-year view, home prices stayed positive – they just appreciated more slowly than they did at the peak of the pandemic. To get a more detailed picture of some of the trends in the market, we need to look at monthly data. 

The monthly graphs below use recent reports from three sources to show that the worst home price declines are already behind us, and prices are on their way back up nationally.

The story this more detailed monthly view tells us is that the last year has been a tale of two halves in the housing market. In the first half of 2022, home prices were climbing, and they peaked in June. Then, in July, home prices started to decline (shown in red in the graphs above). And by roughly August or September, the trend began to stabilize. As we look at the most recent data for the early part of 2023, these graphs also show a recent rebound in momentum with prices ticking back up. Monthly changes in home prices are gaining steam as we move into the busier spring season. 

While one to two months doesn’t make a trend, the fact that all three reports show prices have stabilized is an encouraging sign for the housing market. The month-over-month data conveys a clear, but early, consensus that a national shift is taking place today. In essence, home prices are starting to tick back up.

Andy Walden, Vice President of Enterprise Research at Black Knight, says this about home price trends: 

“Just five months ago, prices were declining on a seasonally adjusted month-over-month basis in 92% of all major U.S. markets. Fast forward to March, and the situation has done a literal 180, with prices now rising in 92% of markets from February.”

Selma Hepp, Chief Economist at CoreLogic, explains the limited supply of homes available for sale is contributing to this positive turn:

“ . . . prices in many large metros appeared to have turned the corner, with the U.S. recording a second month of consecutive monthly gains. . . . The monthly rebound in home prices underscores the lack of inventory in this housing cycle.” 

Here’s What This Means for You 

  • Sellers: If you’ve been holding off on selling because you’re worried about what was happening with home prices and how it would impact the value of your home, it may be time to jump back in and partner with an agent to list your house. You don’t have to put your needs on hold any longer because the latest data shows a turn in your favor. 
  • Buyers: If you’ve been waiting to buy because you didn’t want to purchase something that would decrease in value, you now have the peace of mind things are looking up. Buying now lets you make your move before home prices climb more and gives you the chance to own an asset that typically grows in value over time. 

SBottom Line

If you put off your plans to move because you were worried about home prices falling, data shows the worst is already behind us and prices are actually rising nationally. Partner with a local real estate professional so you have an expert to explain what’s happening with home prices in your area.

The Worst of the Home Price Declines Is Behind Us [INFOGRAPHIC]

The Worst of the Home Price Declines Is Behind Us [INFOGRAPHIC]

The Worst of the Home Price Declines Is Behind Us [INFOGRAPHIC] Simplifying The Market

Some Highlights

While home prices vary by local area, they’ve already hit their low point nationally, and now they’re starting to rise again.

Last July, prices started to decline, but around February, they began climbing back up.

If you put your plans to move on hold waiting to see what would happen with home prices, reach out to a local real estate expert to discuss if now’s the right time to jump back in.

The Worst Home Price Declines Are Behind Us [INFOGRAPHIC]

The Worst Home Price Declines Are Behind Us [INFOGRAPHIC]

The Worst Home Price Declines Are Behind Us [INFOGRAPHIC] Simplifying The Market

Some Highlights

While home prices vary by local area, they’ve already hit their low point nationally, and now they’re starting to rise again.

Last July, prices started to decline, but around February, they began climbing back up.

If you put your plans to move on hold waiting to see what would happen with home prices, reach out to a local real estate expert to discuss if now’s the right time to jump back in.

Pin It on Pinterest